Historians Set Record Straight On 5 Events That Shaped America
Authored by Janice Hisle via The Epoch Times,
As America celebrates its 250th birthday, it’s prime time for historians such as Jeff Bloodworth to set the record straight.
Bloodworth, a professor at Pennsylvania’s Gannon University, noted that it had become trendy among historians to “demythologize” the Founding Fathers.
“But it has gone too far,” he told The Epoch Times. “The achievements of the Founders and the founding are obscured by the lists of sins.”
Now, he thinks “the pendulum is swinging back” toward a more balanced, nuanced, and accurate view of the Founders—and about other aspects of American history.
Through his role with Heterodox Academy—a bipartisan group advocating for open inquiry on college campuses—Bloodworth said he sees “there’s a real pushback against this stuff.”
Any fair appraisal of the Founders requires “lauding their achievements but also recognizing their omissions and their flaws and their hypocrisies,” he said.
Bloodworth and two other historians who spoke to The Epoch Times shed light on myths, misrepresentations, and misunderstandings about the nation’s foundational period; The Epoch Times also reviewed dozens of historic references for this story.
Without historical knowledge, it’s easy to “get sucked into believing things have never been worse, that there’s never been a time like this—and that just isn’t true,” Bloodworth said.

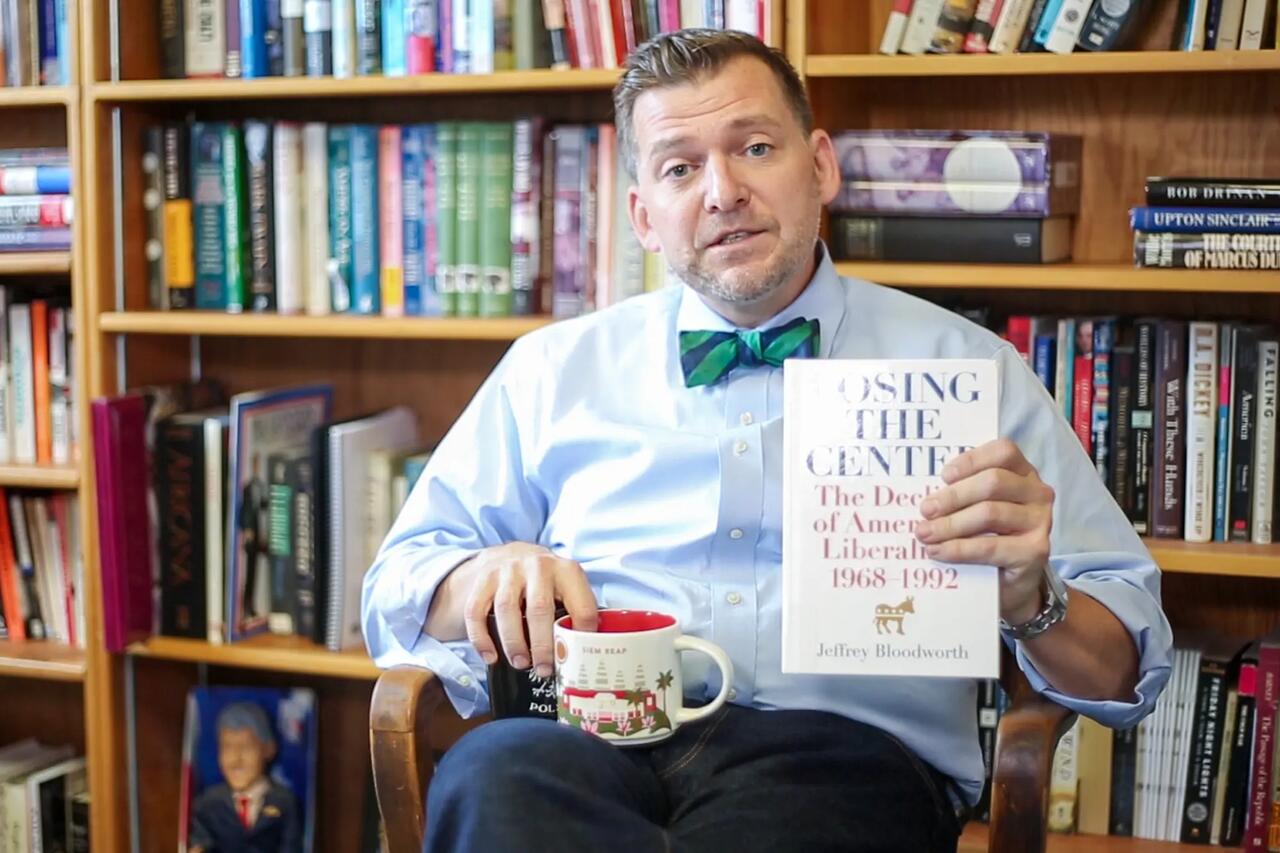
Jeff Bloodworth, professor of history, holds up a copy of his book
Stanley Schwartz, a professor at Cedarville University in Ohio, echoed many of Bloodworth’s observations.
Stanley Schwartz, assistant professor of history at Cedarville University in Cedarville, Ohio. Courtesy of Cedarville University
When students question how early American history relates to them, he responds that issues the Founders faced remain relevant. Those include “how to govern well,” he said, along with “how to relate to foreign powers.”
Many students who expected to be bored in class end up realizing that history “speaks to a person, helps you find your roots, find your place in the world,” Schwartz said.
Anna Vincenzi, a professor at Hillsdale College in Michigan, said learning about America’s history fulfills “a deeply human need ... to know the truth about where we came from.” That knowledge helps people understand “the good things about the history that has brought us here, and also the origin of the problems.”
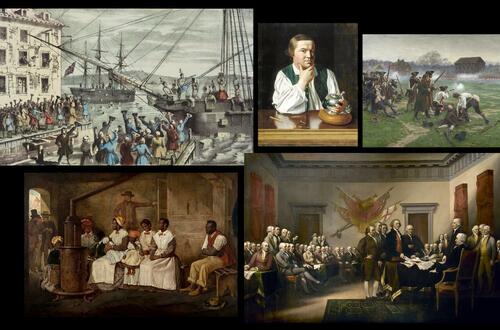
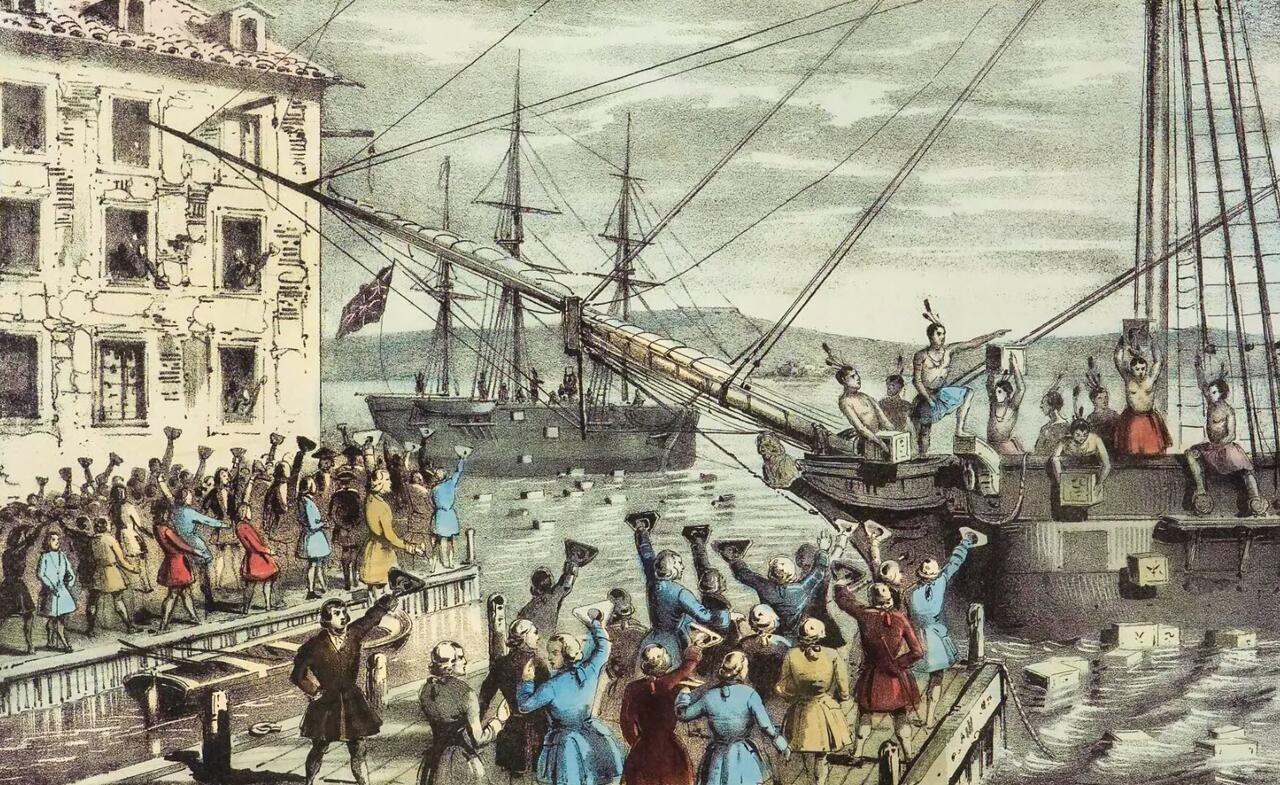
The Boston Tea Party and Why It Happened
On Dec. 16, 1773, hundreds of angry colonists—many disguised as Native Americans—dumped 92,000 pounds of tea into Boston Harbor.
The Boston Tea Party thus became one of the most iconic acts of defiance in U.S. history. Yet modern Americans often misconstrue the reasons for the protest and overestimate its aftereffects, historians say.
Yes, the British Parliament’s passage of the Tea Act of 1773 sparked the protest. But contrary to popular modern belief, the act resulted in lower tea prices.
So why did the act anger the colonists so much?
Part of the reason: It reinforced an existing import tax on tea.
Another factor: Drinking tea is so quintessentially British that “taxing tea is ... like making them feel like they’re not quite British,” Vincenzi said. “It was perceived as a statement on their status as British citizens.”

A work of art by Nathaniel Currier depicts the 1773 Boston Tea Party, entitled “The Destruction of Tea at Boston Harbor,” created in 1846. Colonists known as the “Sons of Liberty” dressed as Mohawk American Indians and smashed 342 chests of tea and emptied the contents—valued at nearly $2 million today—on Dec. 16, 1773. Public Domain
The larger issue, however, was that colonists had no representation in the British Parliament. Yet Parliament repeatedly imposed policies “without the consent of the people through their representatives, in a way that they say is violating the rights and liberties of a British citizen,” Vincenzi said.
Those actions conflicted with the British constitution’s traditional limits on the king’s power, dating to the 13th century, she said.
At the time of the tea party, American colonists were drinking about 1.2 million pounds of tea each year. Much of it came from England and was subject to taxes imposed by the Townshend Revenue Act, according to the Boston Tea Party Ships and Museum.
American colonists started smuggling lower-priced tea from the Dutch and other European markets.
In response, Parliament imposed the Tea Act, which helped a private British company, the East India Tea Company, undercut prices of the smuggled tea. If colonists bought that cheaper, British-subsidized tea, they still would be forced to pay the Townshend Act’s import duty.
Thus, many colonists feared that acquiescing would embolden the British government to impose even more taxes.
The Sons of Liberty—some of whom were tea smugglers—began organizing meetings to address “the tea crisis.”
Up to 6,000 people met on Nov. 29, 1773, after the first shipload of unwanted tea docked in Boston Harbor. Attendees reached a consensus: The tea would be sent back to England and no tax would be paid.

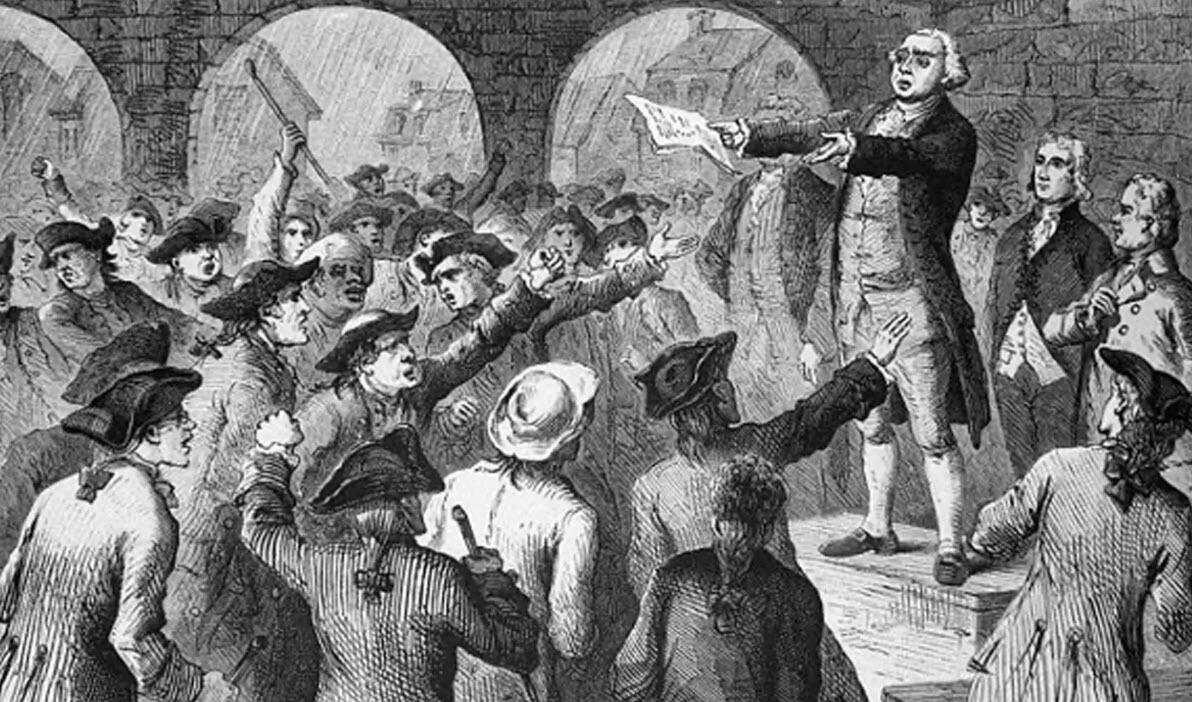
An engraving made by John Karst in 1865 depicts John Lamb, a Sons of Liberty leader, reading the British Parliament’s Tea Act of of 1773 at New York City Hall on Dec. 17, 1773. Colonists took issue with the Act as they had no representation in the British Parliament. John Karst/Public Domain
After exhausting all legal remedies to achieve those goals, leaders executed their last-ditch secret plan: trashing the tea.
Protesters donned wool blankets, grabbed tomahawks, and smeared coal dust on their faces—called “Indian dress” then. The disguises weren’t meant to be convincing; they mostly served to conceal identities so protesters could avoid punishment.
Tea partiers smashed 342 chests of tea and emptied the contents—valued at nearly $2 million today.
The protest had an impact—but not in the way many people might think.
“While the Tea Party itself didn’t mobilize Americans en masse, it was Parliament’s reaction to it that did,” according to a History.com article.
In 1774, the British enacted “punitive measures meant to teach the rebellious colonists who was boss,” the article said. The British closed Boston Harbor, replaced Boston’s elected officials with the king’s appointees, and forced private citizens to quarter British troops in their homes.
Those actions inspired colonists to hold the first Continental Congress meeting.
“Revolution was officially in the air,” the article said.

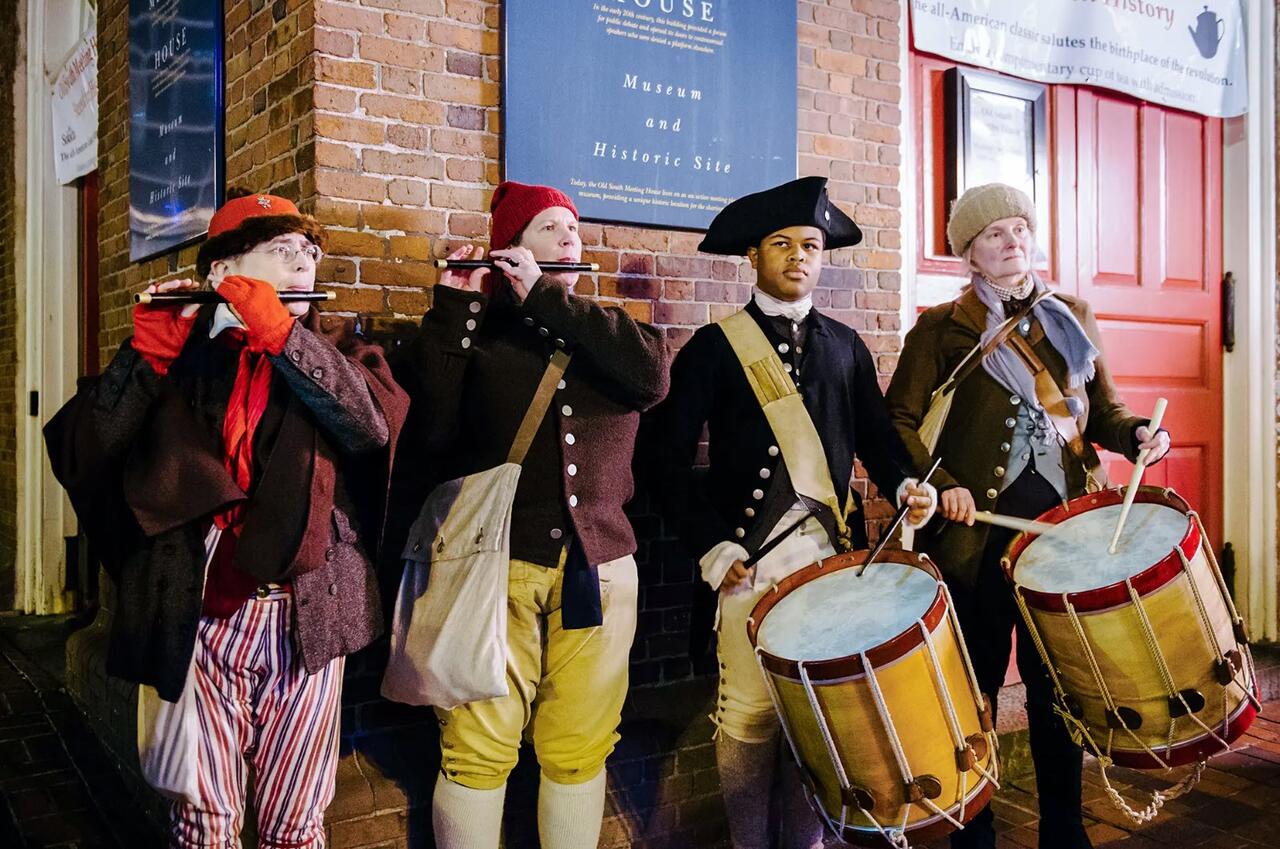
Colonial fife and drum corps play in front of the Old South Meeting House during the Boston Tea Party 250th Anniversary celebration, in Boston in 2023. The Boston Tea Party has became one of the most iconic acts of defiance in American history. Courtesy of Caroline Talbot/December 16.org
Patriot Paul Revere and ‘The British Are Coming!’
Revere was among “many messengers spreading the alarm” across the Massachusetts countryside on April 18 and 19, 1775, according to the National Park Service.
The Revere-as-lone-rider myth arose partly from the celebrated poem “Paul Revere’s Ride” by Henry Wadsworth Longfellow. It omits any mention that other horsemen helped alert townspeople about British soldiers heading toward Concord.
There, the soldiers intended “to arrest patriots and seize colonial militia stockpiles,” the CIA said in an April 2026 article.
Notably, before his famous ride, Revere and others formed “the first Patriot intelligence group on record,” the CIA said in a report about the role intelligence played in the American Revolution.
Called “The Mechanics” or “The Liberty Boys,” the secret group of about 30 men grew out of the old Sons of Liberty organization that opposed British taxes on colonists, the CIA said.
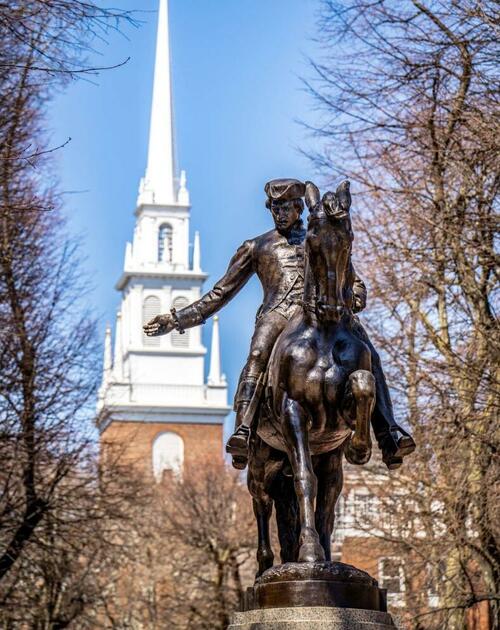
A statue of Paul Revere near Old North Church in Boston on April 8, 2026. Historical records from that era suggest that Revere did not shout “The British are coming!” Instead he warned, “The regulars are coming!” The term, “regulars,” referred to the British professional soldiers. Samira Bouaou/The Epoch Times
Starting in late 1774, the group gathered information to oppose British authority. In 1775, operatives exposed “the cover story the British had devised to mask their march on Lexington and Concord,” the CIA said.
That information laid the foundation for Revere’s ride.
As he rode, Revere never shouted, “The British are coming!”
That phrase “would not have made sense at the time,” because many of Revere’s fellow colonists considered themselves to be British, according to the Paul Revere House website.
Historical records from that era suggest that Revere instead warned, “The regulars are coming!” The term “regulars” referred to the British professional soldiers.
According to the Paul Revere House, the enduring but inaccurate “British are coming” phrase appears to have originated during a dinner party in 1822—nearly a half-century after Revere galloped into history.
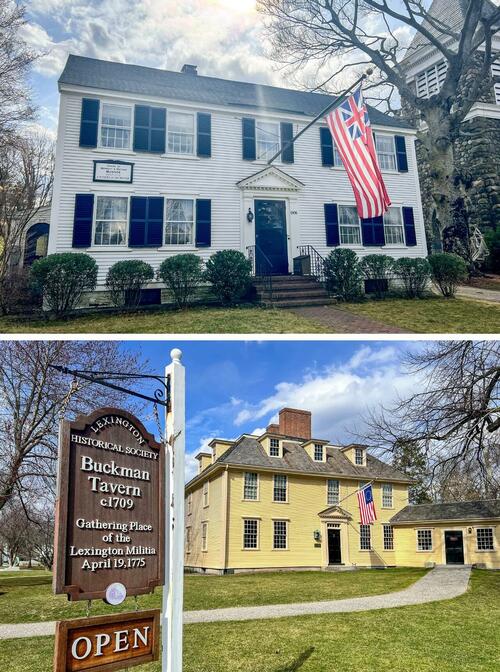
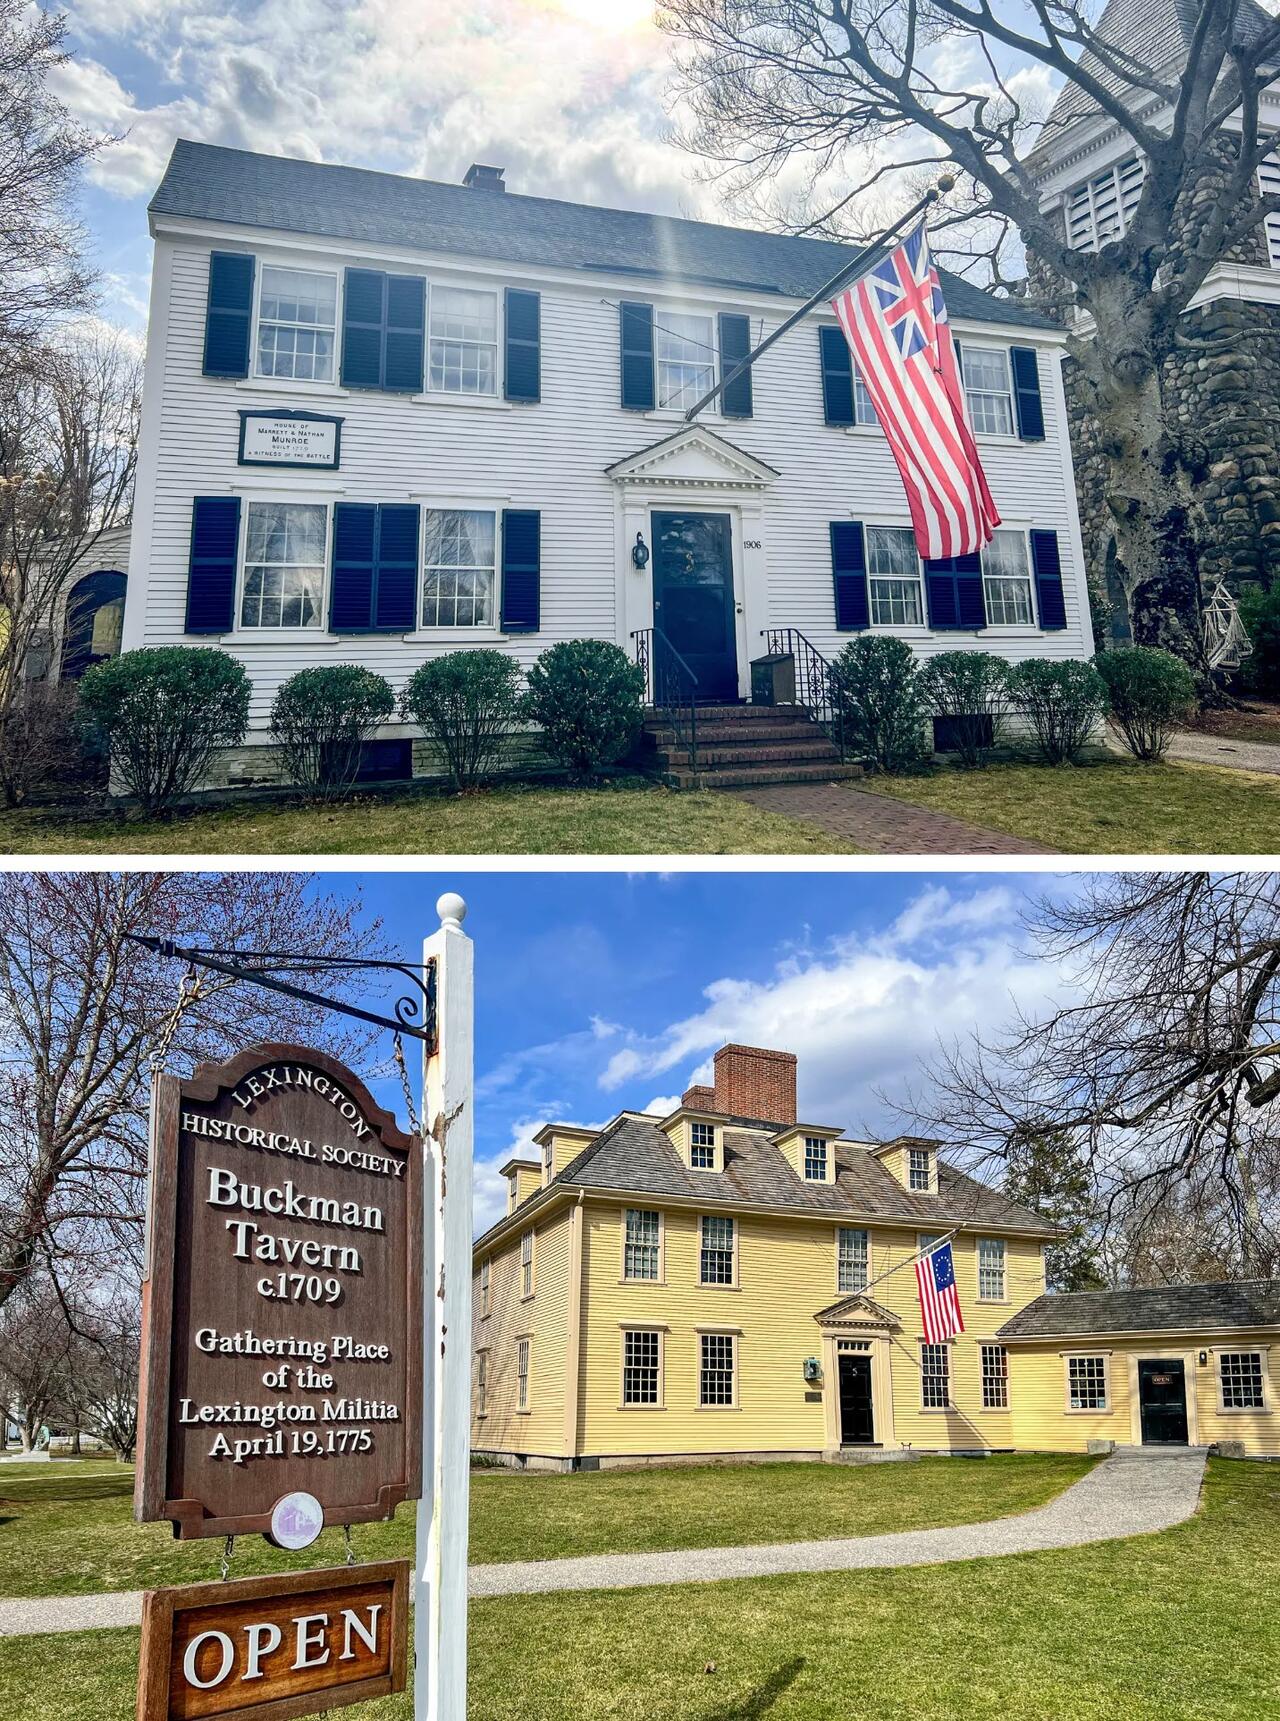
(Top) The Marrett and Nathan Munroe House in Lexington, Mass., on March 26, 2025. (Bottom) The Buckman Tavern on the Lexington Battle Green. The Battle of Lexington, which began the American Revolution, took place in this area. Learner Liu/The Epoch Times
‘The Shot Heard ’Round the World’ and Its Origin
Historians still disagree over who fired the first shot in the initial clash between British troops and Patriots.
They do agree that the first volleys were fired at Lexington, but the next ones fired at Concord reverberated more loudly in history.
Weeks before those pivotal confrontations, Revere’s secret group had forewarned Patriots about British Gen. Thomas Gage’s plans to send troops to Lexington and Concord.
Late on April 18, 1775, about 800 British regulars started their 20-mile march toward Concord, according to the American Battlefield Trust.
After covering about 12 miles, the soldiers reached Lexington as the sun rose the next morning and confronted about 70 armed colonists on the town green.
Although the rebels began dispersing under their commander’s order, “at some point a shot rang out,” the trust said.
“The nervous British soldiers fired a volley, killing seven and mortally wounding one of the retreating militiamen. The British column moved on towards Concord, leaving the dead, wounded, and dying in their wake.”
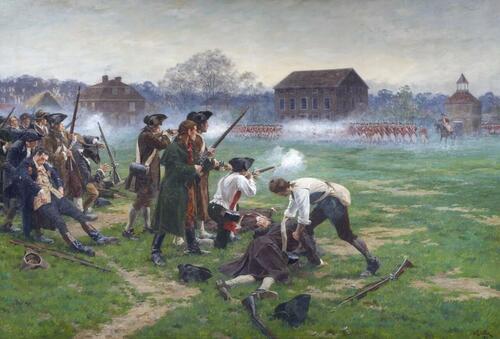
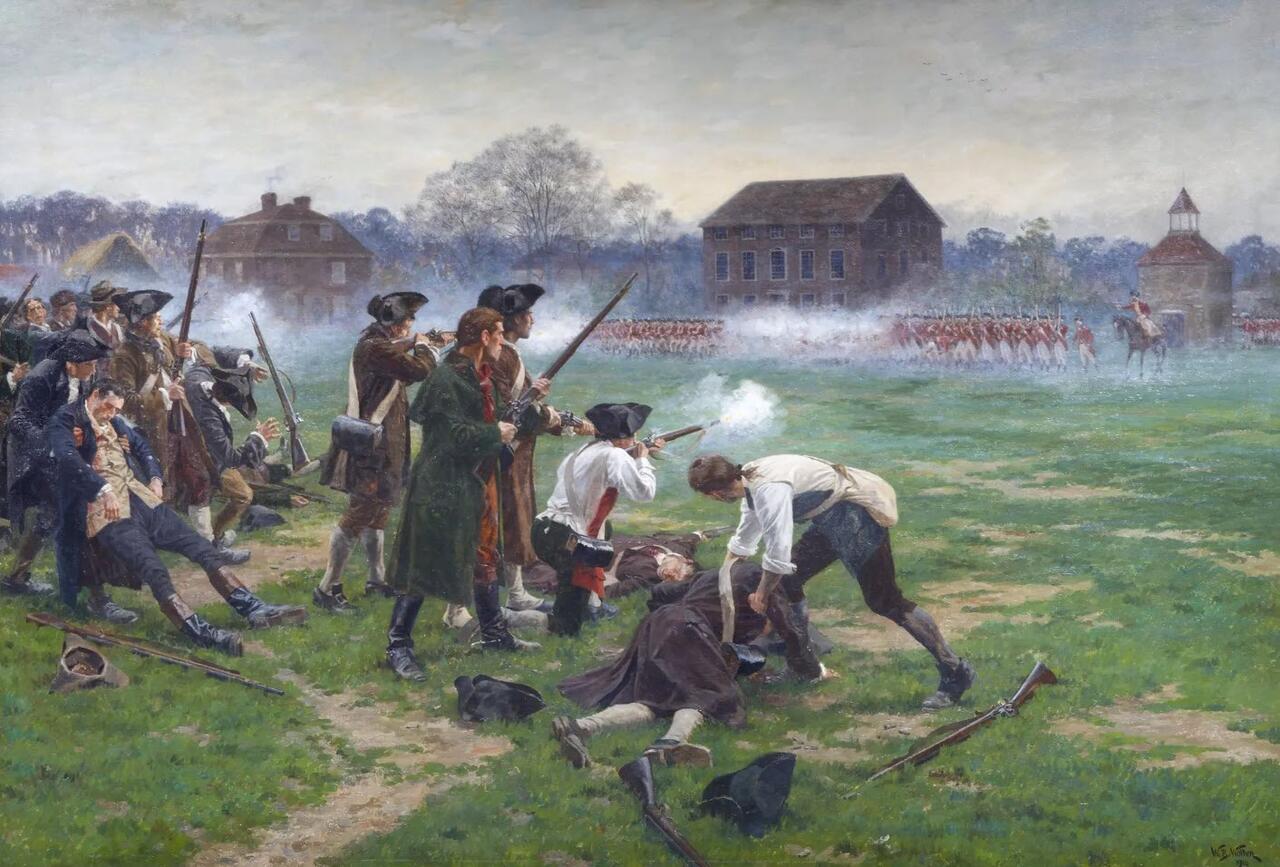
An oil painting by William Barnes Wollen created in 1910 depicts the Battle of Lexington on April 19, 1775. About 800 British soldiers reached Lexington as the sun rose on April 19, 1775, and confronted about 70 armed colonists on the town green. Public Domain
In Concord, because of warnings from Revere’s secret group, colonists had hidden or relocated most of their stockpile before the redcoats arrived, the park service notes.
As a result, “the mission to destroy military goods in Concord turned out to be a miserable failure for the British,” the park service said.
The British soldiers also encountered a much larger contingent in Concord.
Within 24 hours, “more than 70 of the King’s finest troops lay dead and many more wounded,” along with 49 militiamen, the park service said. “Following a horrific day of bloodshed, the war General Gage hoped to avoid arrived at his doorstep.”
Many years later, a poem immortalized Concord as the site where a ragtag bunch of farmers, merchants, and blacksmiths stunned the world by overcoming the sophisticated redcoats.
“Concord Hymn” by Ralph Waldo Emerson debuted July 4, 1837, during the dedication of a Battle of Concord monument. The poem’s second line reads, “Here once the embattled farmers stood/ And fired the shot heard ‘round the world.”
Decades later, the 1970s educational cartoon series “Schoolhouse Rock” inspired children across the United States to sing “Shot Heard ’Round the World,” a song that retraces early U.S. history. Today, it still sparks nostalgia among Americans who grew up at that time—and amusement among younger generations.
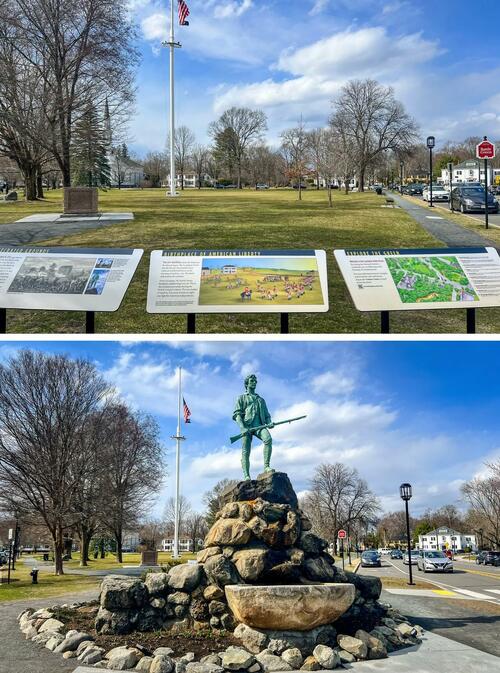
(Top and Bottom) The Lexington Battle Green, where the Battles of Lexington and Concord started, in Lexington, Mass., on March 26, 2025. In Concord, because of warnings from Revere’s secret group, colonists had hidden or relocated most of their stockpile before the redcoats arrived. Learner Liu/The Epoch Times
Why the Revolution Started and How It Evolved
Although the colonists’ war would later be called “the Revolution” and “the war for American independence from Britain,” it was neither revolutionary nor independence-focused at the outset, historians say.
Schwartz said his Cedarville students will sometimes say that the Revolution centered on “destroying things to make everyone equal.”
That’s not so. Harvard University historian Bernard Bailyn pointed out that “things were already a lot more equal in the colonies than they were in Great Britain,” Schwartz said.
“In America, it was a lot easier to have the right to vote, a lot easier to own land ... to participate in society,” Schwartz said.
Colonists saw the British Crown trying to take away those advances.
“So the American Revolution wasn’t about tearing down old structures to get to equality,” he said. “It was about preserving healthy traditions of equality in the community that already existed.”
Vincenzi said her research challenges popular impressions of the nation’s early history.
“I do think Americans think of the American Revolution as more revolutionary ... more of a break from the British political tradition than it actually was,” said the Italian-born professor.
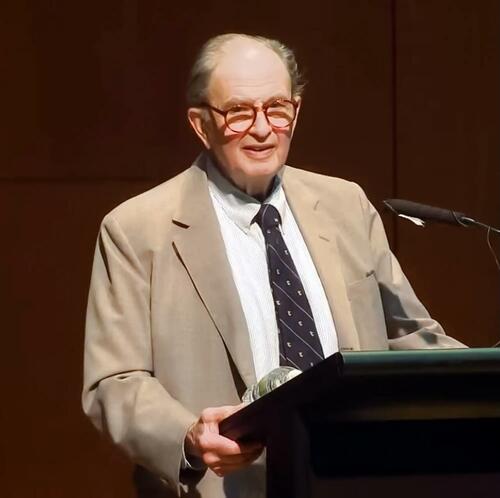
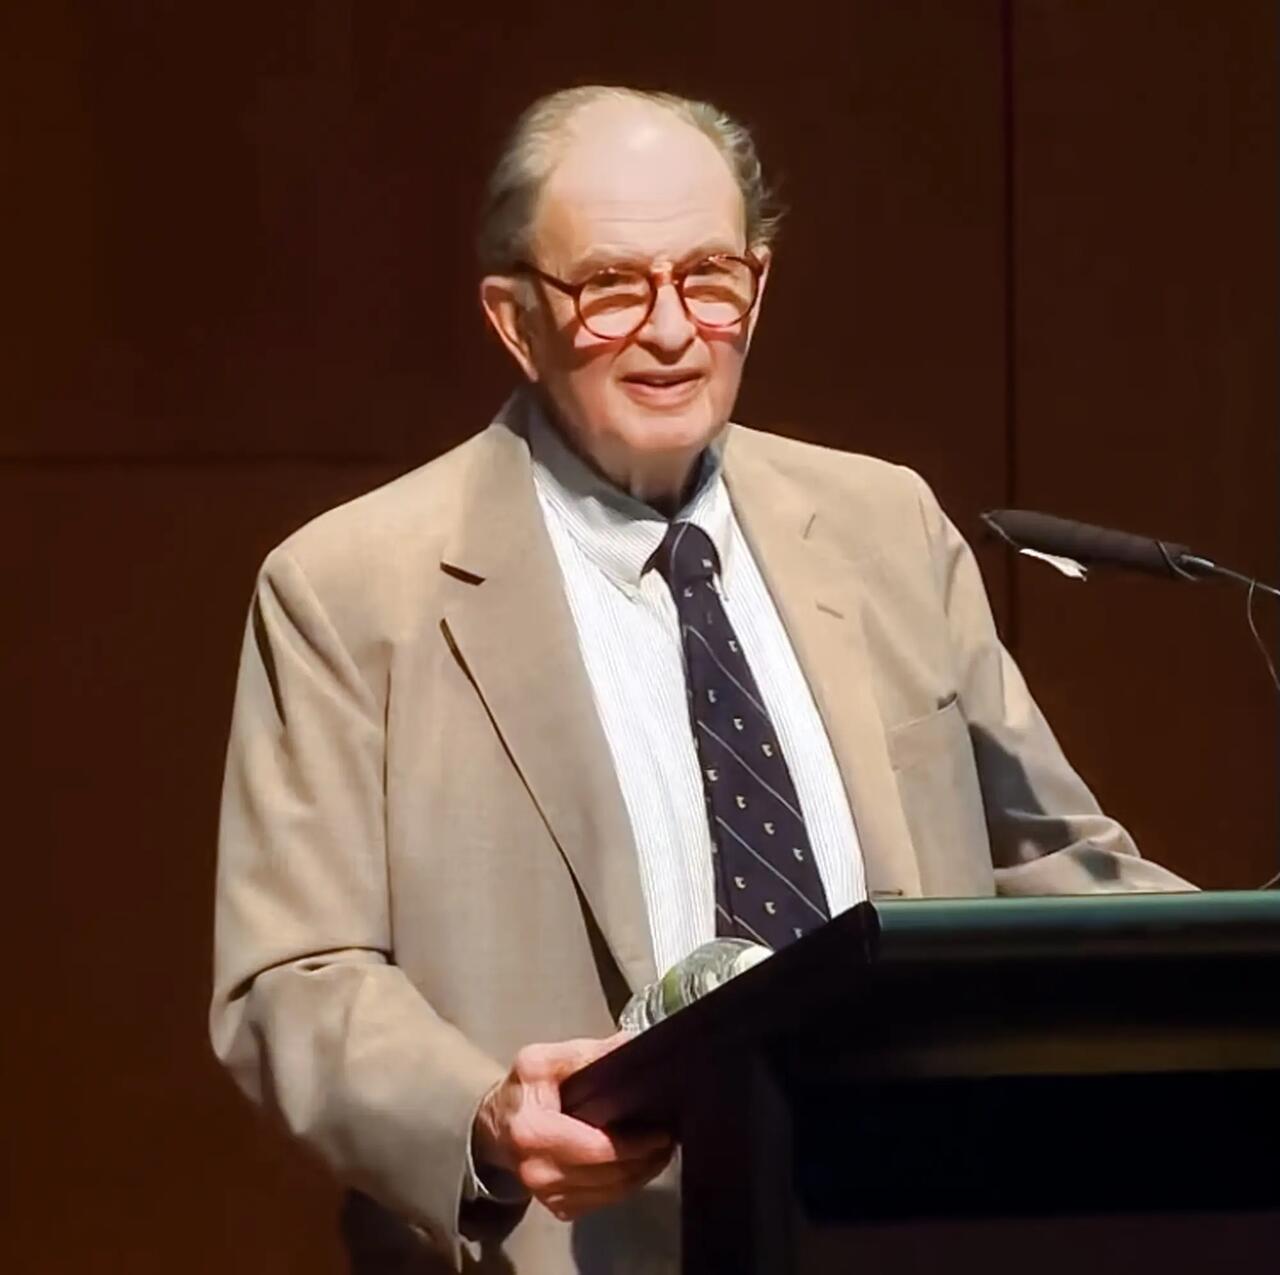
A still taken from video of Bernard Bailyn, Harvard University professor and historian, as he delivers a lecture at Brown University in Providence, R.I., on June 7, 2012. Bailyn pointed out that “things were already a lot more equal in the colonies than they were in Great Britain.” Screenshot via Brown University/CC BY 3.0
“That’s not a bad thing. There is a richness of tradition to be rediscovered there. ... It speaks to the wisdom of the Founders; they knew that starting something on a blank slate is more dangerous than building on a very rich tradition of thought.”
And the “revolutionists” weren’t initially focused on breaking free from England, either.
When the first shots rang out at Lexington and Concord, militiamen still considered themselves “loyal subjects to England’s King George the III,” the park service said. “Independence was the furthest thing from their minds.”
Rather, they “assembled to defend their rights, as they perceived them under English law.”
Vincenzi said she often reminds her Hillsdale students that Revolutionary-era Americans “wanted to be British, and to look British.”
They bought porcelain tea sets that looked “as aristocratic and as British as possible,” Vincenzi said. They also admired and emulated British fashion, portrait styles, and architectural designs.
Calls for independence finally surfaced in 1776.
Until then, “Americans felt British,” Vincenzi said. Yet the British treated the colonists as second-class citizens.
“And that is what eventually ... pushes them to consider independence,” she said.
Had that not been the case, “Americans could still be carrying a British passport,” Vincenzi said, echoing a statement she heard from noted historian Jack Greene.

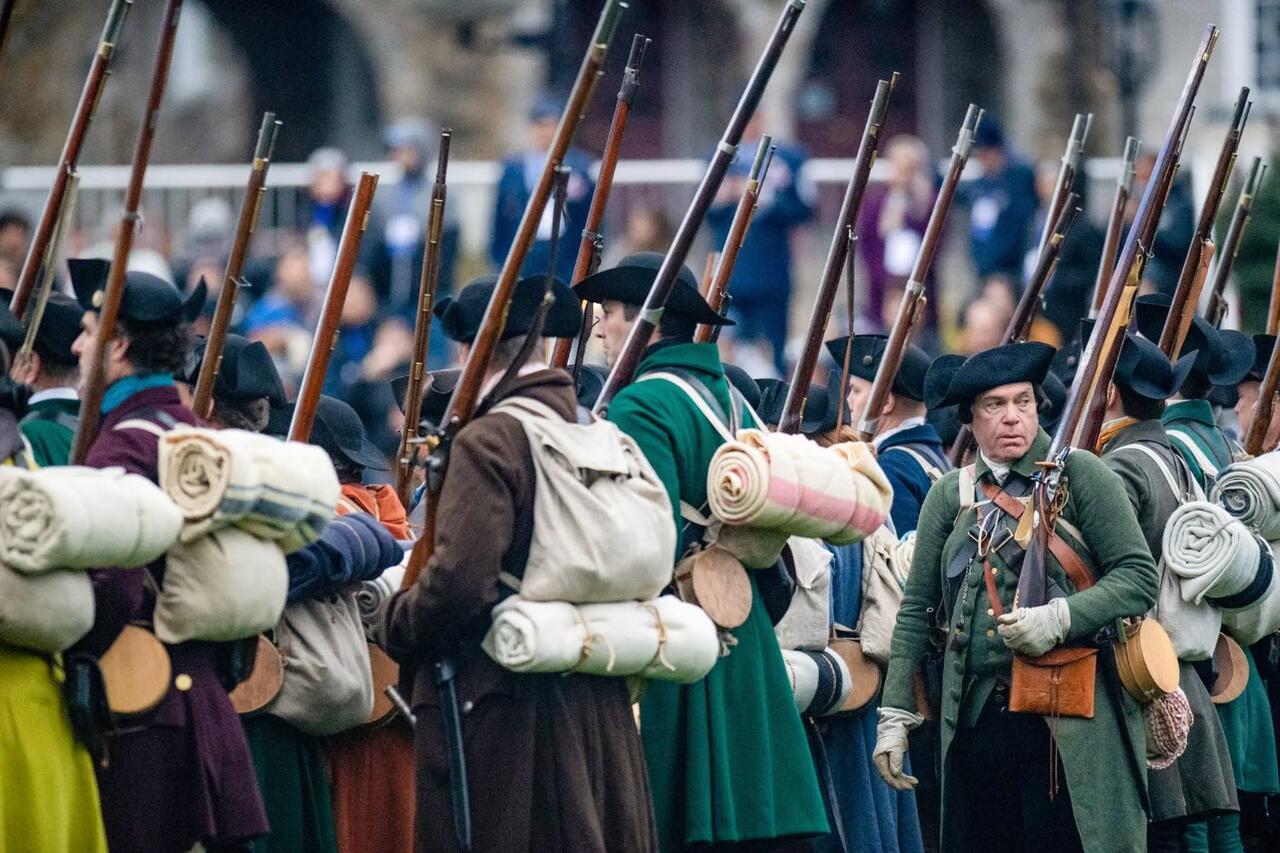
Lexington Minute Men gather for a battle reenactment of the Battle of Lexington and Concord as part of Patriot's Day celebrations in Lexington, Mass., on April 18, 2026. The following day marks the 251st anniversary of the Battle of Lexington and Concord, the first major military actions between the British Army and the Colonial American militias during the American Revolutionary War. Joseph Prezioso / AFP via Getty Images
The Founding Documents and Whom to Credit for Them
Some people mistakenly believe that Thomas Jefferson penned the entire Declaration of Independence by himself in a single night before Congress ratified the document unanimously on July 4, 1776.
The truth: Jefferson worked with four other committee members. They chose him to write the first draft—a process that took three weeks, followed by 86 edits from committee members and the Continental Congress, the National Park Service said.
“He was especially sorry they removed the part blaming King George III for the slave trade, although he knew the time wasn’t right to deal with the issue,” a National Archives article said.
The Declaration listed grievances against the British government and outlined core principles of the fledgling nation.
Years after defeating the British, America’s leaders met to establish the Constitution, which remains the supreme law of the land today.
Jefferson, however, never signed the document.
“This is the most popular myth at the National Constitution Center, especially when visitors enter our Signers’ Hall, [comprising] statues of the Constitution’s different signers—and ask where the Jefferson statue is,” the center’s website said.
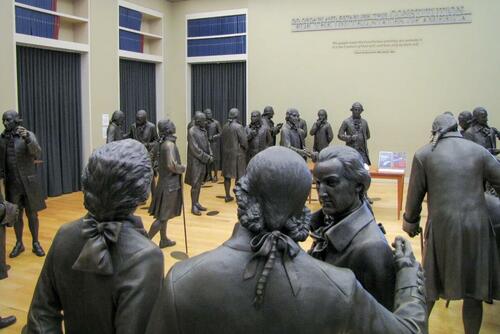
Life-sized statues of the signers of the Constitution in Signers' Hall at the National Constitution Center, in Philadelphia, on July 18, 2012. Thomas Jefferson did not sign the Constitution–he was in Paris as the U.S. envoy to France at the time. Ziko van Dijk/CC BY-SA 3.0
Jefferson, the U.S. envoy to France, was in Paris when the Constitutional Convention met in Philadelphia in 1787.
When people think about crafting the Constitution, “we emphasize the two bright young men, James Madison and Alexander Hamilton,” Schwartz said. Both deserve credit for major roles in shaping the document. But in doing so, “we overlook a lot of the compromisers, the deal-makers, the older statesmen” whose influence was less obvious but essential, he said.
Those delegates “took Madison and Hamilton’s ideas, made them workable, built compromises out of them, and often changed them completely or went a completely new direction,” Schwartz said.
Those lesser-known contributors include Roger Sherman and Oliver Ellsworth. The two Connecticut delegates helped bridge an impasse over the rights of small states versus large states. The Great Compromise provided equal representation for each state in the Senate and population-based seats in the House of Representatives.
Sherman is among six Founders who signed both the Declaration of Independence and the Constitution. The other five were George Clymer, Benjamin Franklin, Robert Morris, George Read, and James Wilson.

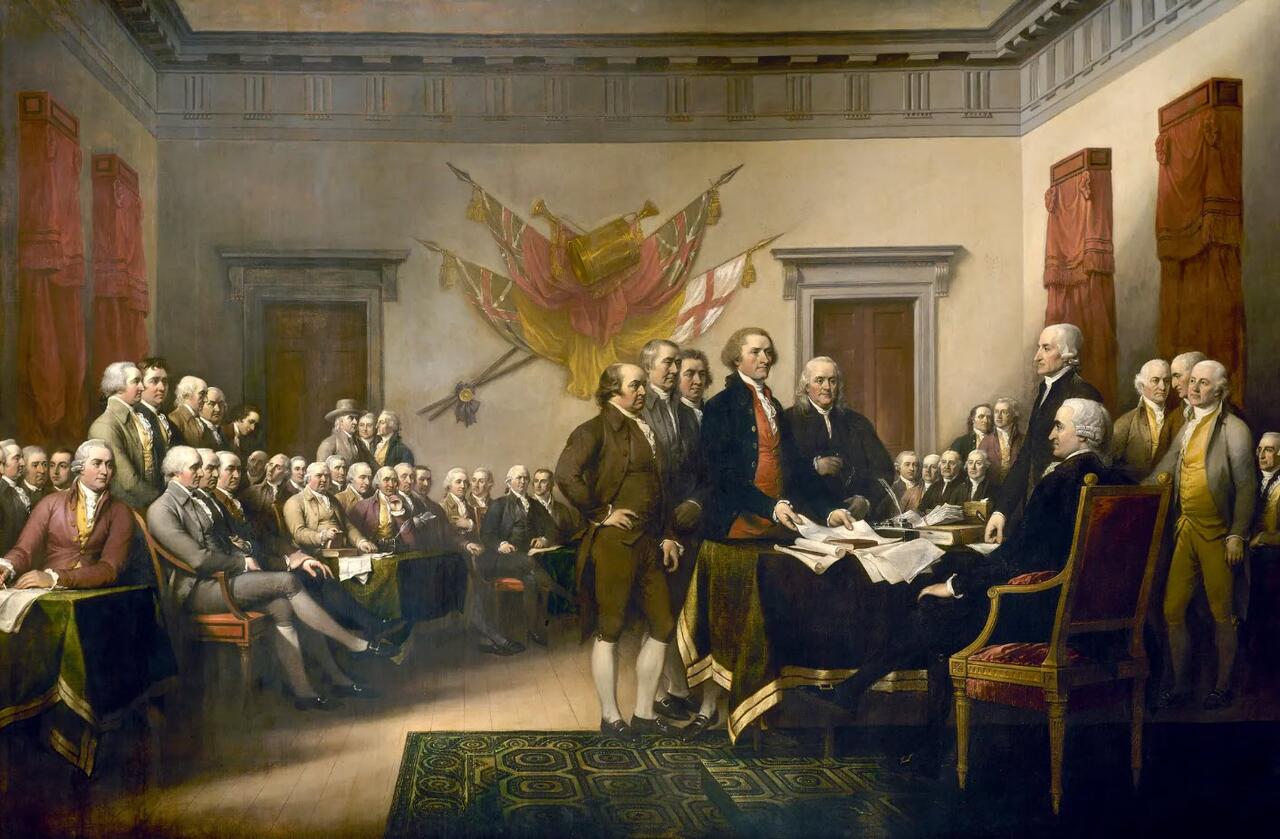
John Trumbull's painting, “Declaration of Independence,” depicts the five-man drafting committee of the Declaration of Independence presenting their work to the Congress. The painting can be found on the back of the $2 bill. The original hangs in the U.S. Capitol rotunda. It does not represent a real ceremony; the characters portrayed were never in the same room at the same time. Another Believer/CC BY-SA 3.0
Schwartz emphasized that the Founders weren’t “just this collection of really intelligent people.” Many members of the Constitutional Convention had business experience, had traveled the world, and were “middle-aged or a little bit older.”
Thus, “they had wisdom, a lot of practical experience,” Schwartz said, which strengthened the Constitution.
Many people don’t realize that beyond the “young firebrands” known for their constitutional contributions, quiet leadership came from delegates such as George Washington, an elder statesman and war hero who became the first president.
“Just by being there and overseeing the proceedings, he’s adding a lot to it,” Schwartz said.
Without Washington and lesser-known delegates such as Ellsworth and Sherman, America would have ended up with a very different Constitution, he said.
“That’s a lesson that’s relevant for us today. We have a lot of people in our current politics who say, ‘Hey, I’m young. I want to charge to the front of this scene,’” Schwartz said.
“I think the Founders show us a different path. ... It’s good to have big ideas, but you also need people who are going to work hard behind the scenes and get things done.”

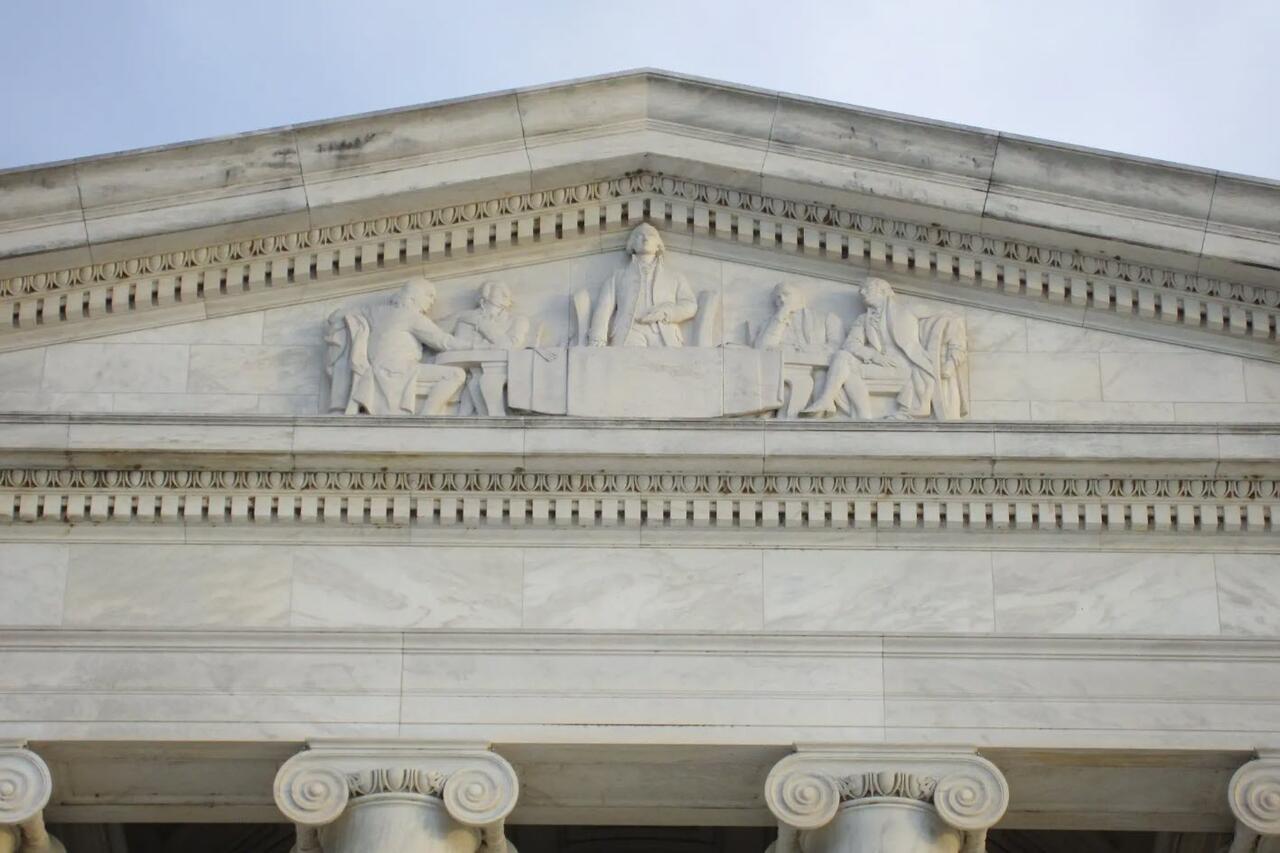
A sculpture by Adolph Alexander Weinman depicts the Committee of Five, on the pediment of the Jefferson Memorial in Washington. The committee was composed of John Adams, Benjamin Franklin, Thomas Jefferson, Robert Livingston, and Roger Sherman. They drafted and presented to the full Congress in Pennsylvania State House what would become the U.S. Declaration of Independence of July 4, 1776. Another Believer/CC BY-SA 3.0
Slavery and How the Founders Saw It
In recent years, young Americans have been taught that the Founding Fathers “were all pro-slavery, they all owned slaves, they all thought slavery was a good thing—and that’s just not true,” Schwartz said. “That’s a big myth and a big mistake that we have to deal with in today’s society.”
Actually, the Founders were divided over slavery; some were very much against it. However, they didn’t insist on action in the Constitution, Schwartz said, because they believed people could see it was dehumanizing—which would lead to its abolishment.
He and Bloodworth concurred on that point.
While it is “appalling” that people could “own other human beings,” Bloodworth said, it’s essential to remember that “slavery was the norm” at the time.
“The past is ‘another country,’ and we have to understand it on its own terms,” he said. “Too often, contextualizing is seen as ‘excuse-making,’ which it’s not the same thing.”
He credits the Founders for embedding “the logic of racial equality” into America’s foundational documents, even though many weren’t yet ready to fully embrace it.
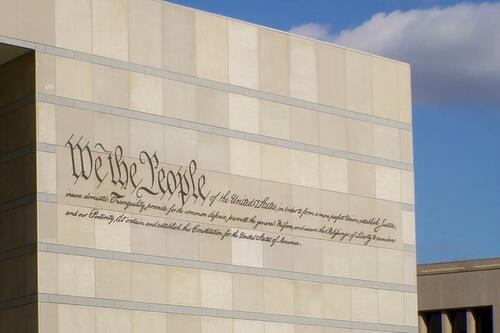
The opening words of the U.S. Constitution are displayed on the exterior of the National Constitution Center in Philadelphia, on Sept. 15, 2003. Roger Sherman is among six Founders who signed both the Declaration and the Constitution. Jeffrey M. Vinocur/CC BY 2.5
“Many of the Founders’ documents indicate that they most certainly believed that slavery was going to ... die a slow death,” Bloodworth said.
Significantly, Washington freed his slaves upon his death.
“It doesn’t erase the fact that he owned slaves,” Bloodworth said, but that “momentous” act set the tone for others to follow suit.
Vincenzi warns against “over-simplified” views of the debate over slavery during the age of the nation’s founding.
“It’s complicated,” she said.
A significant number of delegates to the Constitutional Convention were determined to defend slavery. Many others wanted slavery to be abolished, yet they worried that “the sudden abolition of slavery could create a lot of problems,” Vincenzi said.
They asked questions such as “If you treat people as non-people for decades, how are they going to live once they’re emancipated?”
The slavery issue was a pivotal one that perhaps made a big compromise at the Constitutional Convention inevitable “for the sake of establishing a union that otherwise would have probably not been born,” she said.
Tyler Durden
Sat, 07/04/2026 - 16:20


 via Reuters


 Bloomberg News
Recent comments