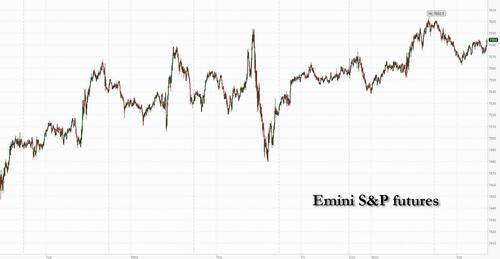
Futures Fall, Chipmakers Tumble After Samsung Rout; Oil Climbs
Stocks fell as freash volatility hit chipmakers after blowout earnings from Samsung Electronics were still not good enough (the company missed some buyside estimates) and left investors wanting even more, and sent its stock tumbling as much as 11%, forcing another 20 minute halt of the Kospi. As of 8:00am ET, S&P futures were down 0.2% and Nasdaq futures fall 1%, with chip stocks sliding in premarket trading (both Micron and Sandisk dropped more than 5%), following a tech led selloff in Asia, while SpaceX is joining the index today, potentially leading to positioning adjustments across global tech. European stocks are little changed. Meanwhile, Brent crude futures rise 1.5% and are back above $73 a barrel following another Iran attack on a Qatari LNG ship crossing the Strait of Hormuz near Oman. European natural gas futures are up around 4%. Bonds trade heavy as a result with a decline in Treasuries pushing US 10-year yields up 3 basis points to 4.50%. The Bloomberg Dollar Spot Index inches higher with modest moves across the G-10 complex. Precious metals fall as does Bitcoin. US economic data calendar includes ADP weekly employment change (8:15am), May trade balance (8:30am) and June New York Fed 1-year inflation expectations (11am).
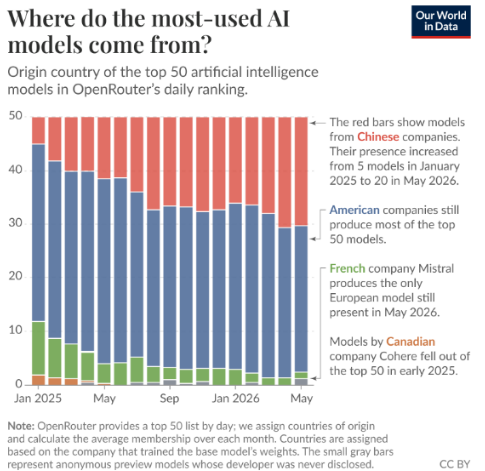
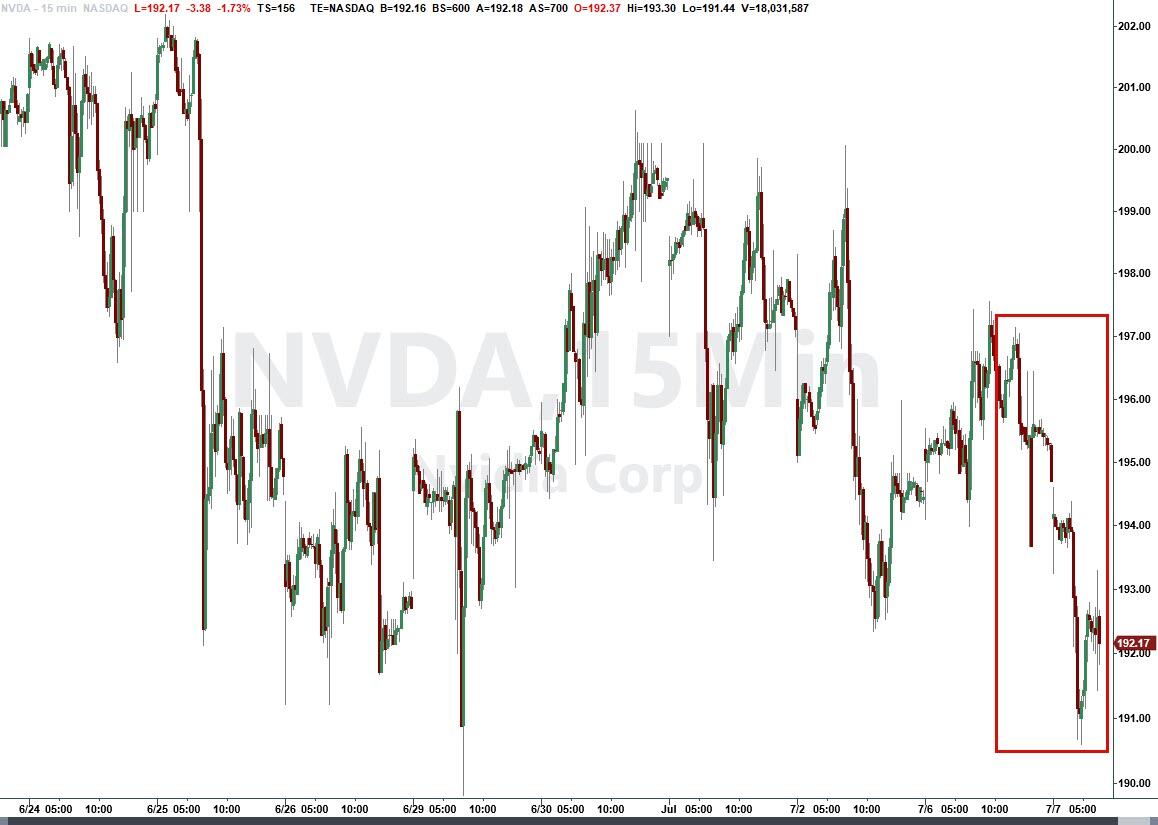
In premarket trading, Magnificent Seven are mixed: Nvidia slips 2.2% afters Reuters reported that China’s DeepSeek is developing its own chip to help power artificial intelligence systems (Amazon +1%, Microsoft +1.5%, Meta +1%, Alphabet +0.4%, Apple +0.6%, Tesla -0.4%)
- Chipmakers, neo-cloud firms and AI infrastructure names are under pressure after Samsung Electronics reported preliminary results that failed to meet high investor expectations.
- Marvell Technology (-3.2%), Qualcomm (-1.9%), Intel (-3.4%), AMD (-3.1%) and Broadcom (-2.0%) are all lower
- Storage and memory stocks are weaker, including Sandisk (-5.3%), Western Digital (-5.6%), Seagate (-4.4%) and Micron (-5.1%)
Broadcom (AVGO) falls 3% after Erste Group downgraded the chipmaker to hold, noting the stock’s high valuation.
- Cloudflare Inc. (NET) rises 3% as Scotiabank raised its recommendation on the technology company to sector outperform, anticipating upside from artificial intelligence.
- Crinetics Pharmaceuticals (CRNX) surges 99% after Vertex Pharmaceuticals entered a definitive agreement to buy the company for $85 per share in cash, for a total equity value of approximately $10 billion.
- Fiserv (FISV) is up 5.6% after the Wall Street Journal reported that big Wall Street banks have held preliminary discussions about a deal to acquire a debit network owned by the financial-technology company.
- Plug Power (PLUG) climbs 2.3% after receiving an electrolyzer order to power a hydrogen project in Australia.
In other corporate news, Vertex Pharmaceuticals agreed to buy Crinetics Pharmaceuticals for $10 billion in cash — its largest deal ever — to expand into endocrinology. Investors in a KKR retail private credit fund got back all of their requested cash in the second quarter, a sign that individual investors’ skittishness over the asset class may be easing
As reported earlier, Samsung - the world’s biggest memory maker - tumbled as much as 11% in Seoul after its quarterly report failed to wow traders even after profit surged 19-fold. Peers such as Micron Technology and Sandisk tumbled more than 5% in US premarket trading. Nasdaq futures were down more than 1% with SpaceX set to join the index, potentially leading to positioning adjustments across global tech.
“Overnight was ugly, despite a monster Samsung operating profit beat,” said Rich Privorotsky, head of European One Delta trading at Goldman Sachs Group Inc. “Classic ‘travel then arrive’ price action.”
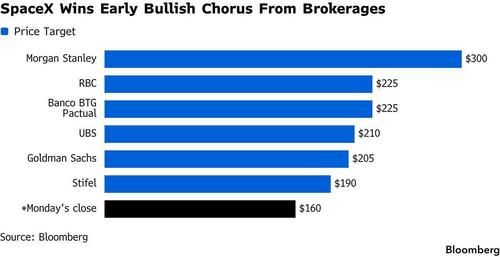
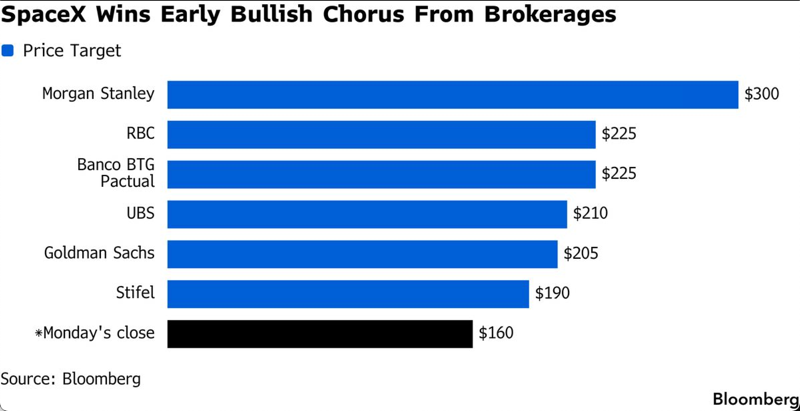
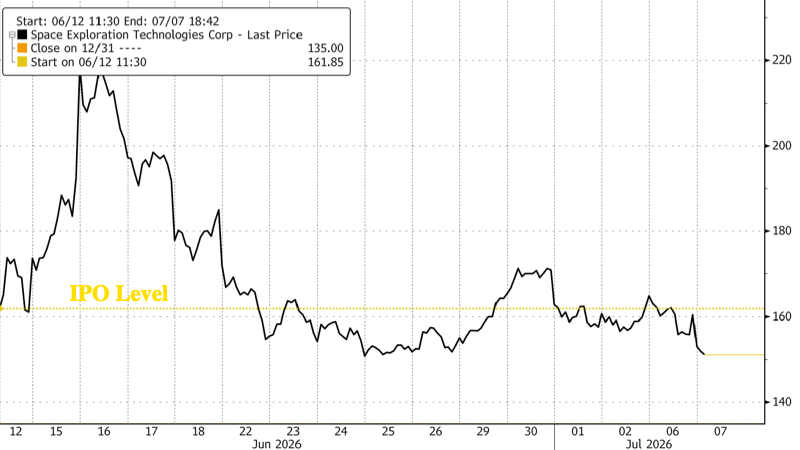
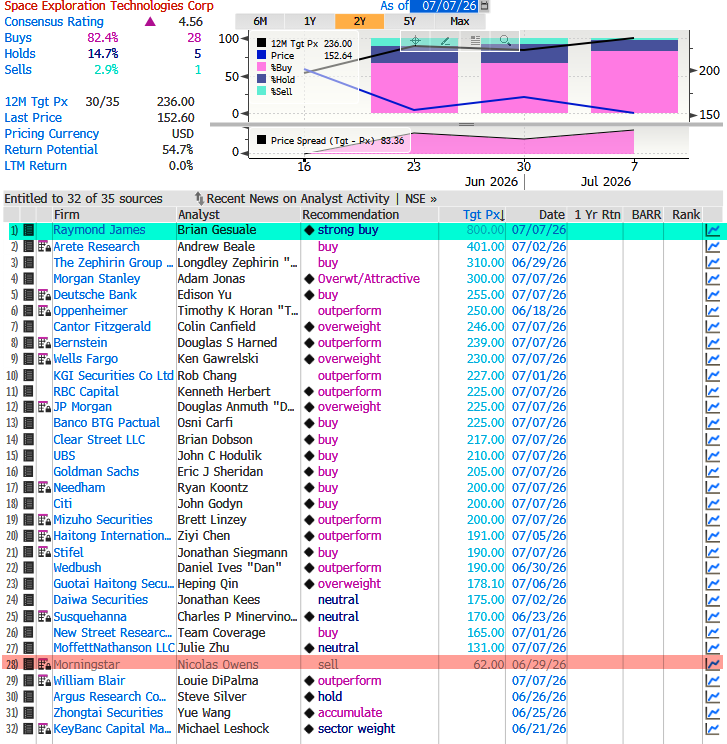
The sell-side is jumping on board Elon Musk’s rocket, with at least six brokers, including Morgan Stanley, Goldman Sachs and UBS, initiating on the stock with buy-equivalent ratings. While investors expect SpaceX’s inclusion in the Nasdaq 100 to trigger some mild swings, the rocket and AI company is winning a clear buy consensus. At least six brokers, including Morgan Stanley, Goldman Sachs Group Inc. and UBS Group AG, have initiated coverage of the stock with buy-equivalent ratings.
“The SpaceX inclusion will undoubtedly cause some volatility today, but ultimately it should benefit shareholders through improved liquidity,” said Michael Field, chief equity strategist at Morningstar. “Short-term pain, long-term gain.”
For Marija Veitmane, head of equity research at State Street Global Markets, the latest tech selloff in tech again creates a buying opportunity. “Samsung earnings confirmed the insatiable demand for everything IT that the AI revolution has created,” she said. “There is no other sector that has similar earnings power.”
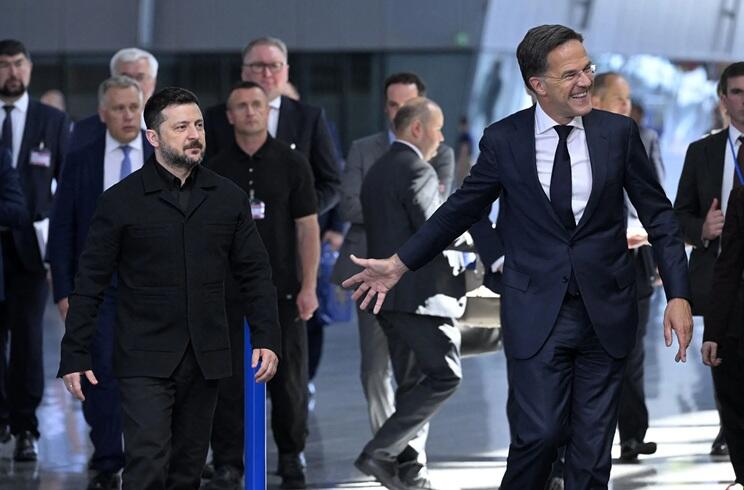
Elsewhere, WTI oil is rallying, back above $69 a barrel, after a Qatari ship was attacked in the Strait of Hormuz. Defense is back on traders’ radars as the two-day NATO summit starts in Turkey. Trump meets Zelenskyy there on Wednesday.
European stocks are little changed. Europe’s Stoxx 600 saw a majority of its members rise even though the index was 0.1% lower, as declines in mining and tech sectors fail to offset gains in personal care shares. Here are some of the biggest movers on Tuesday:
- Saab shares rise as much as 7.2% after Morgan Stanley double-upgraded the Swedish defense firm to overweight, citing an attractive valuation and strong order momentum.
- Carrefour shares rise as much as 4.3% after being named as RBC’s top pick among European food retailers, based on the French grocer’s more focused approach.
- Shell shares gain 3.4% after a trading update from the oil major showed strong oil and gas trading profits amid the turmoil caused by the Middle East conflict.
- Kion shares rise as much as 5.9% after Morgan Stanley upgraded the industrial firm and upped its price target by a third, pointing to an attractive entry point and scope for a re-rating.
- Victrex shares surge as much as 18% after the British thermoplastic company reported revenue growth in the third quarter.
- NCC rises as much as 7.5% after the cybersecurity business said it plans to return cash through a tender offer priced at a premium to Monday’s closing price.
- Keller Group shares rally as much as 19% as the ground engineering specialist raised its outlook for the year on strength in North America.
- European semiconductor stocks are falling across the board after Samsung Electronics, the South Korean memory chipmaker at the heart of the AI trade in the past few months, reported preliminary results that failed to meet higher investor expectations.
- Siemens Energy shares fall as much as 6.9% on a broadly weak day for so-called AI winners after Barclays downgraded its recommendation to underweight, seeing limited upside to consensus through 2030.
- ITV shares fall as much as 6.4% after JPMorgan downgraded the stock to neutral from overweight, saying terms of the Sky deal failed to meet higher expectations.
- DiaSorin falls as much as 3.1% after BNP Paribas cuts the stock to underperform from neutral, saying initial epidemiology data doesn’t support the Italian healthcare company’s guidance for the year.
- PolyPeptide drops as much as 8.3% after RBC Capital Markets cut the stock to sector perform from outperform, saying it’s moving to the sidelines following the Swiss company’s recent share outperformance.
Asian stocks fell, led by technology shares as investors rotated into other sectors after earnings from leading memory chipmaker Samsung Electronics. The MSCI Asia Pacific Index dropped more than 1%, with Samsung among the biggest drags along with peers SK Hynix and Kioxia. South Korea’s Kospi tumbled 4.9%, leading declines among regional benchmarks. Stocks rose in Singapore and the Philippines. Samsung’s 19-fold quarterly profit surge underwhelmed the market, sending investors flocking to more defensive sectors. Non-memory AI plays also benefited, with shares of Japanese banks and a gauge of Chinese technology stocks advancing. “Buy side expectations sat well above consensus” for Samsung, said Billy Leung an investment strategist at Global X Management. “My view is this is a positioning reset within a structural story, not the end of it.” The market is also looking ahead to the US trading debut of SK Hynix on Friday. Outside of tech, other key events this week include earnings from heavyweights Fast Retailing and Tata Consultancy Services. Here Are the Most Notable Movers
- Kuaishou shares fall in Hong Kong after Tencent’s move to trim its stake in the firm and cease to be a substantial shareholder. Chinese robotics supplier stocks rise as investors’ sentiment is boosted by Shanghai bourse’s approval of Unitree’s IPO registration.
- LG Energy shares closed 6.4% lower on the Korean Exchange after the company reported preliminary second-quarter earnings that missed analyst estimates, as lackluster US support for electric vehicles failed to offset surging demand for energy-storage systems.
- Sapporo shares gained the most since August 2024 after the firm unveiled a strategic joint venture with Carlsberg.
- Shares of Zhipu, which trades as Knowledge Atlas Technology, gained in Hong Kong as investors’ concerns over lockup expiry eased.
- Trent shares tumble after first-quarter standalone revenue growth misses some analysts’ estimates.
- Meituan shares rose 4.5% in Hong Kong, after its investee Unitree Robotics’ IPO plan was approved by the regulators.
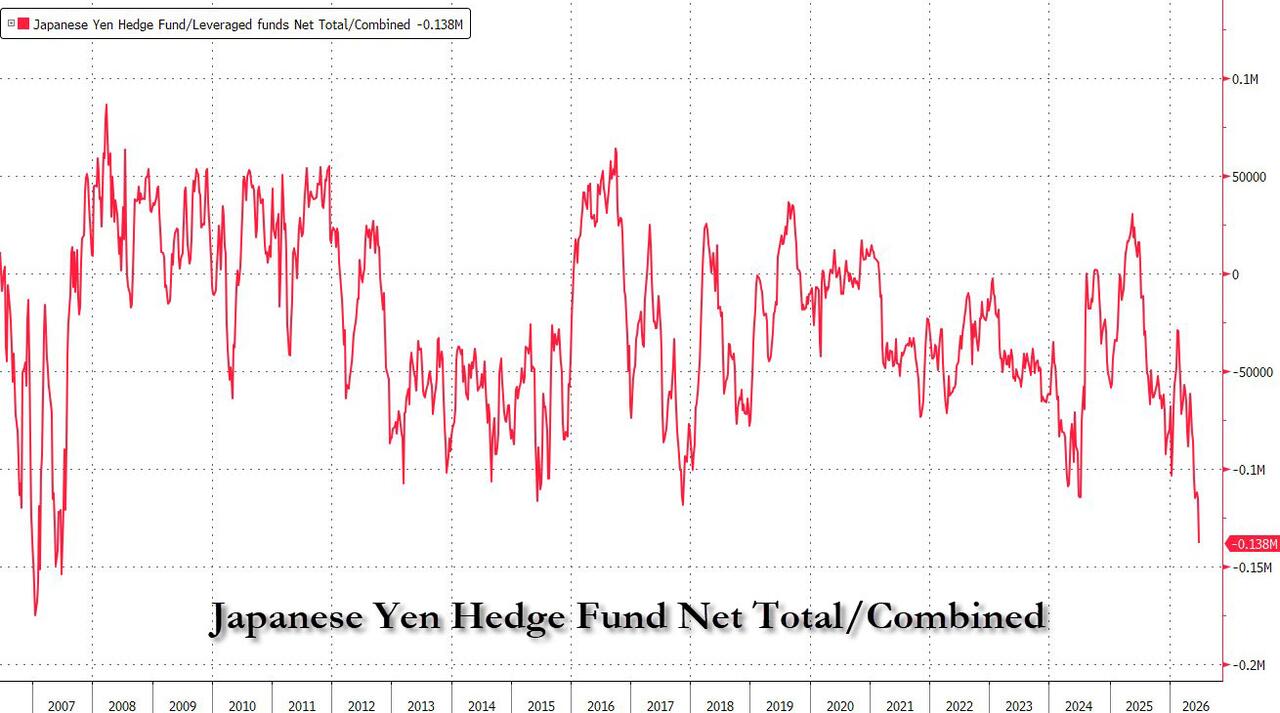
In FX, the Bloomberg Dollar Spot Index inches higher with modest moves across the G-10 complex. The yen was a touch stronger around 161.90 per dollar even as positioning data showed hedge funds turned the most negative on the currency since 2007.
In rates, bonds traded heavy as a result with a decline in Treasuries pushing US 10-year yields up 3 basis points to 4.50%. Treasuries hold small front-end-led losses, lifting 2- to 5-year yields by about 3bp and flattening the curve. US yields are 2bp to 3.5bp cheaper across the curve with 2s10s and 5s30s spreads flatter by 0.5bp and 1.5bp; 10-year, higher by about 2bp near 4.49%, slightly underperforms bunds and gilts in the sector. European bonds are also under pressure from rising oil prices after attacks on shipping in and around the Strait of Hormuz. European government bonds nurse similar sized losses. A major bond issuance announcement from Amazon, which is kicking off an 8-part IG bond deal added further pressure to US yields. IG dollar issuance slate includes a few names already, headed by Italy’s benchmark 5Y/10Y/30Y borrowing. Seven issuers priced nearly $12b of new US investment-grade bonds Monday, paying about 3bps in concessions on deals that were 2.9 times covered. Here is the main event that was just announced:
- *AMAZON.COM SEEKS TO RAISE AT LEAST $25B IN US DOLLAR BOND SALE
- *AMAZON.COM KICKS OFF EIGHT-PART US INVESTMENT GRADE BOND SALE
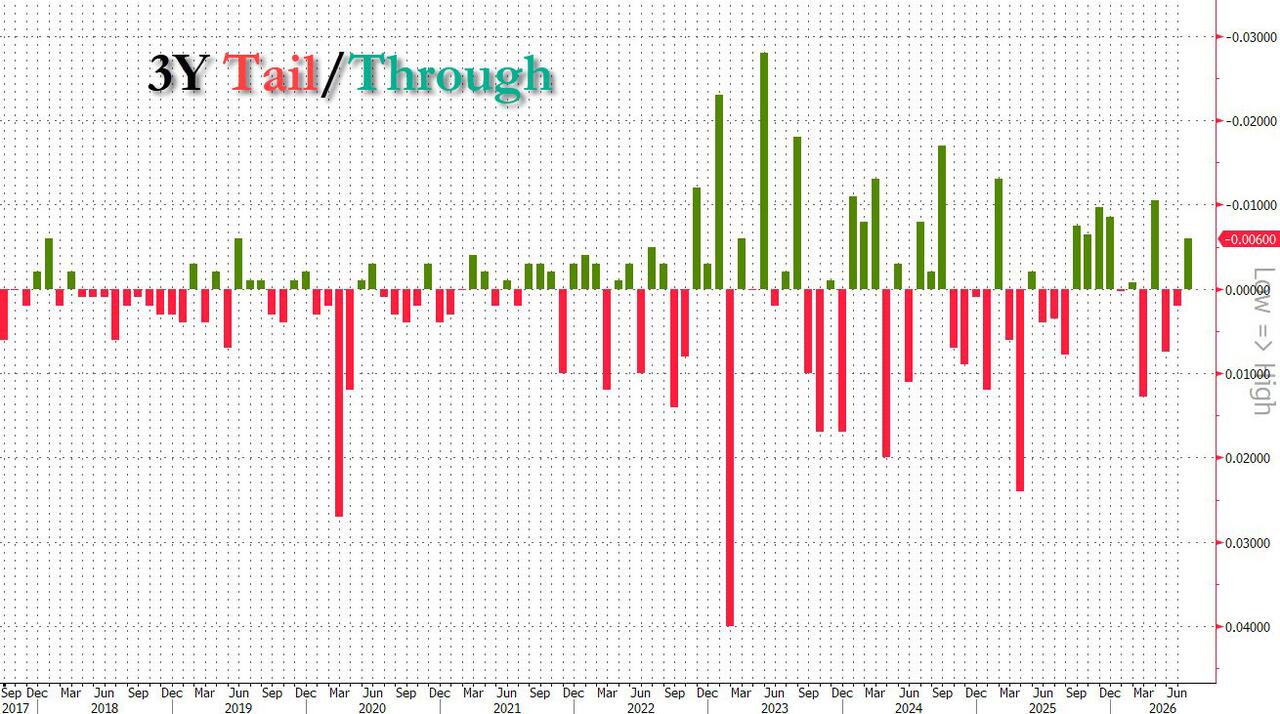
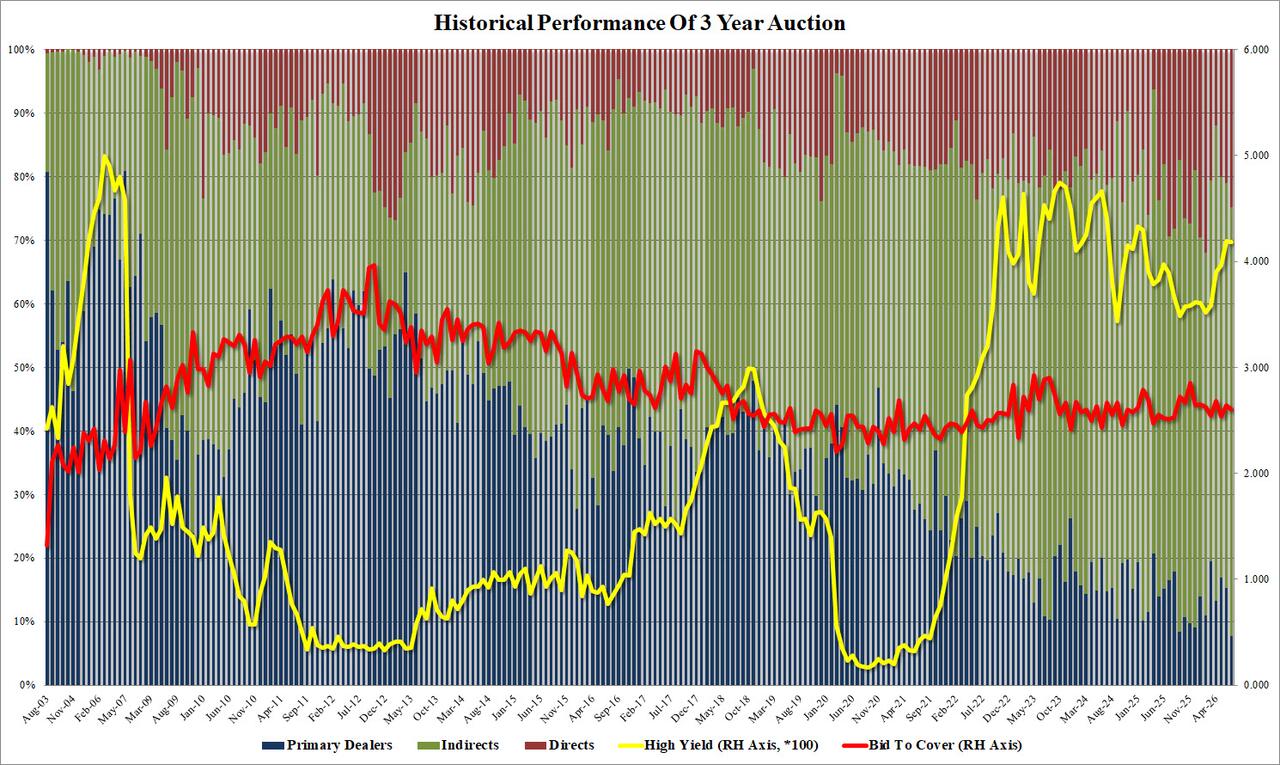
July Treasury auctions kick off with $58 billion 3-year new issue, to be followed by $39 billion 10-year and $22 billion 30-year reopenings Wednesday and Thursday. WI 3-year yield near 4.175% is ~2bp richer than last month’s, which tailed by 0.3bp.
In commodities, Brent crude headed for the biggest gain in more than a week., rising 1.5% and are back above $73 a barrel following attacks on shipping in and around the Strait of Hormuz. WTI crude oil futures rose about 1% after reports of vessels being hit around the Strait of Hormuz. European natural gas futures are up around 4%. Precious metals fall as does Bitcoin. Gold slipped to around $4,145 an ounce.
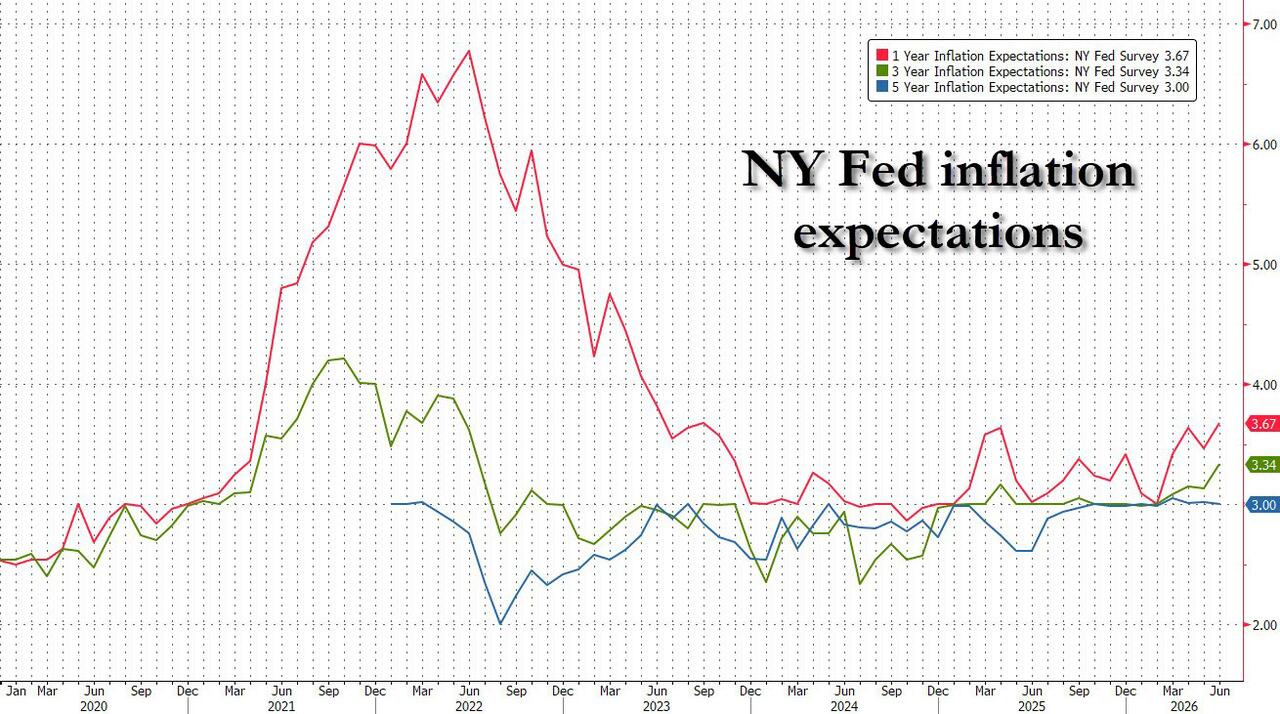
US economic data calendar includes ADP weekly employment change (8:15am), May trade balance (8:30am) and June New York Fed 1-year inflation expectations (11am). Fed speaker slate includes unscripted opening remarks by Governor Bowman at a Financial Stability Board Virtual Outreach Event (7am).
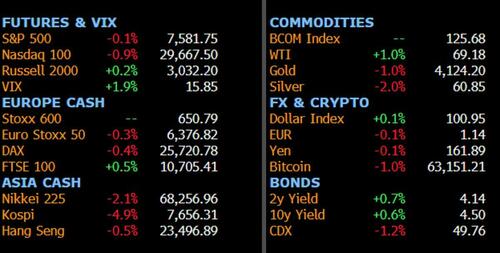
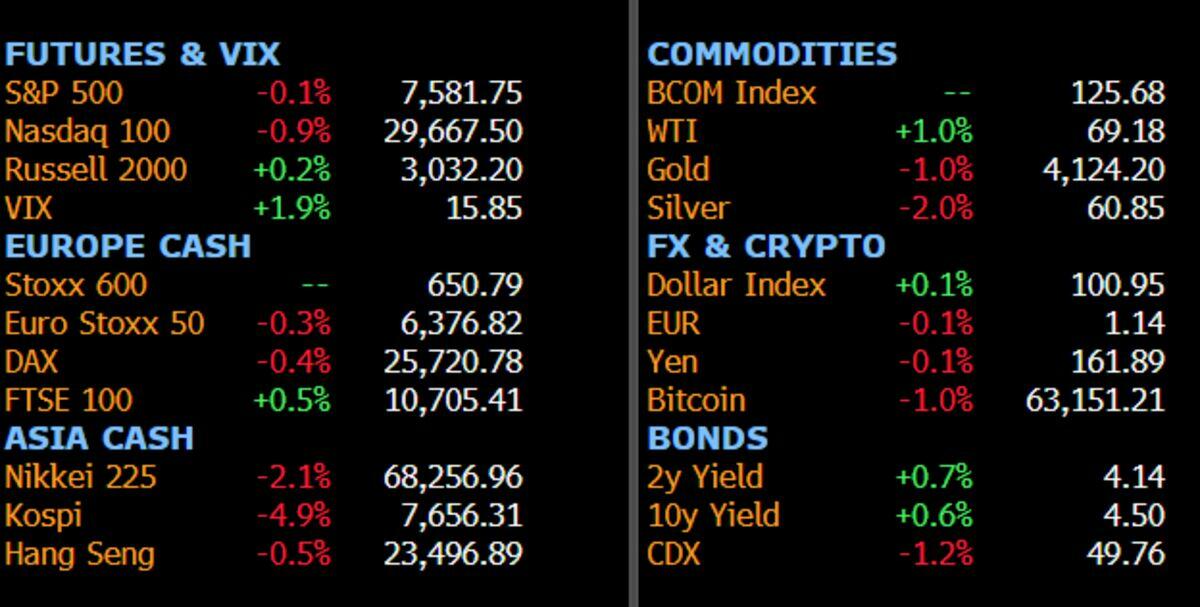
Market Snapshot
Top Overnight News
- Samsung’s record profit failed to meet the lofty expectations fueled by the AI chip boom sending Nasdaq futures lower. The company’s shares sank 9%, leading a plunge in the Kospi that triggered a circuit-breaker suspension. BBG
- AI giants OpenAI, Anthropic, and others are offering extremely aggressive discounts in computing power to win business from startups. WSJ
- Iran’s Islamic Revolutionary Guard Corps fired missiles at two commercial ships near the Strait of Hormuz early Tuesday, according to a senior U.S. official, marking an escalation that threatens to complicate negotiations to end the U.S.-Iran war. WSJ
- The boss of the world’s biggest freight forwarder has said using land routes to transport goods into the Gulf is not a sustainable alternative to voyages through the Strait of Hormuz because of extra costs and delays. FT
- China has stepped up its purchases of oil from producers in the Middle East in recent days, with deep discounts offered by its main supplier Saudi Arabia on Monday seen as likely to boost its buying. FT
- Japan’s 30-year bond sale drew its strongest demand since 2019. BBG
- Belarus’s president Alexander Lukashenko has said his army will not take part in Russia’s invasion of Ukraine, seemingly dismissing Kyiv’s fears that Moscow was pressuring Minsk to join its war effort. FT
- SpaceX won bullish ratings from at least six Wall Street brokers after its IPO quiet period ended. BBG
- Airlines are finally getting some relief at the jet-fuel pump. Fliers may not share in the savings, though. Jet-fuel prices doubled in the weeks after the Iran war started, and carriers raised fares to keep up. Now fuel prices are down 40% from their peak in April, but analysts say fares aren’t likely to follow because travelers keep paying up. WSJ
- Trump posted on Truth Social, calling on senators to pass Reconciliation 3.0.
A more detailed look at global markets courtesy of Newsquawk
Asia-Pac stocks traded entirely in the red, failing to follow on from the positive sentiment seen stateside, as Samsung's Q2 preliminary earnings seemingly disappoint despite beating estimates. ASX 200 fared better vs peers, though still traded with mild losses. IT topped the sector pile while Metals & Mining was the sector underperformer, as precious metals gave back some of last week’s gains. Nikkei 225 traded with losses in excess of 2%, as Kioxia was weighed on by losses in Samsung. KOSPI slumped, with circuit breakers triggered twice, following losses in Samsung. Samsung reported Q2 prelim. figures, in which operating profit beat estimates while revenue printed mid-range of analyst’s expectations (KRW 171tln vs exp. KRW 169-173.9tln). The outlook also included the provisions for employee bonuses, after the Co. agreed to give bonuses equivalent to 10.5% of business performance earnings. Despite the recent selloff, investors are still quite bullish, with analysts citing the increased volatility due to leveraged ETFs as a main reason for the extended selloff, with profit-taking also a key reason. Elsewhere, Hanwha Ocean fell after Canada preferred TKMS (TKMS GY) for its submarine project. Shanghai Comp.and Hang Seng were softer, but to a lesser extent than the Nikkei and KOSPI. Key movers were Tencent and Kuaishou Technology, after the former sold part of its stake in the latter.
Top Asian News
- China State Council approved in principle the 15th Five-Year Plan for building China into a tourism power.
- Japanese top FX diplomat Mimura said have been in close contact with South Korean FX authorities on FX movement.
- China smartphone sales fell 13% Y/Y during the 618 shopping festival as brands raised prices to offset higher memory costs, according to Counterpoint Research. All major Chinese brands except Huawei posted double-digit drops.
- HKMA's Chief Exec. said they are to study 7-day offshore CNY tender mechanism. HKMA's securities regulator said that China and Hong Kong is to build a new electronic trading platform for bond and forex trading in Hong Kong.
- Japanese PM Takaichi is to hold talks with Ishin leader Yoshimura this evening, according to Kyodo.
- Japan's Economy Minister Kiuchi rejects reported that the government is pushing the BoJ to lower rates; said the government blueprint's reference to monetary policy is no different from its previous approach. Japan is not loosening fiscal discipline but rather showing in verifiable form in the economic blueprint.
European bourses (STOXX 600 +0.1%) opened on a modestly firmer footing after losses on Monday. European Tech is in focus after Samsung Electronics shares fell 9.5% as earnings, which topped most analysts' expectations, failed to convince investors of its valuation. European sectors opened with a positive bias, with tech the underperformer as chip names slump following Samsung (STMicroelectronics -5% and ASML -4.6%). Optimised Personal Care is the leader (Unilever +2.5%, makes up 30% of the sector) Autos also does well, Renault +2% was said to have been approached by BYD on two separate occasions in recent years to propose acquiring a stake.
Top European News
- BoE FSR: Proposes the easing of some bank capital rules; the leverage ratio proposal would reduce the requirement by 20bps.
- The EU is set to delay the launch of its European Travel Information and Authorisation system until next year following technical issues and border congestion, the FT reported.
- Andy Burnham has decided not to split the treasury as part of a radical drive to boost Britain's growth, according to FT sources.
FX
- G10s are mostly weaker against the Buck, which attempts to return to levels made on Monday above 101 in DXY. Carry continues to be a theme today as it was on Monday, with high-yielders NOK, GBP flat against the Buck and low yielders underperforming, ex-JPY. On that front, the currency appears to be benefiting from commentary via Japan's Economy Minister who rejected reports that the government is pushing for lower rates.
- GBP is flat against the EUR and Buck with the absence of catalysts giving no bias to the currency today. Some political news overnight incl. reports that likely incoming PM Burnham is considering delaying the announcement of his chancellor until the day he is expected to become PM (potentially 20th July).
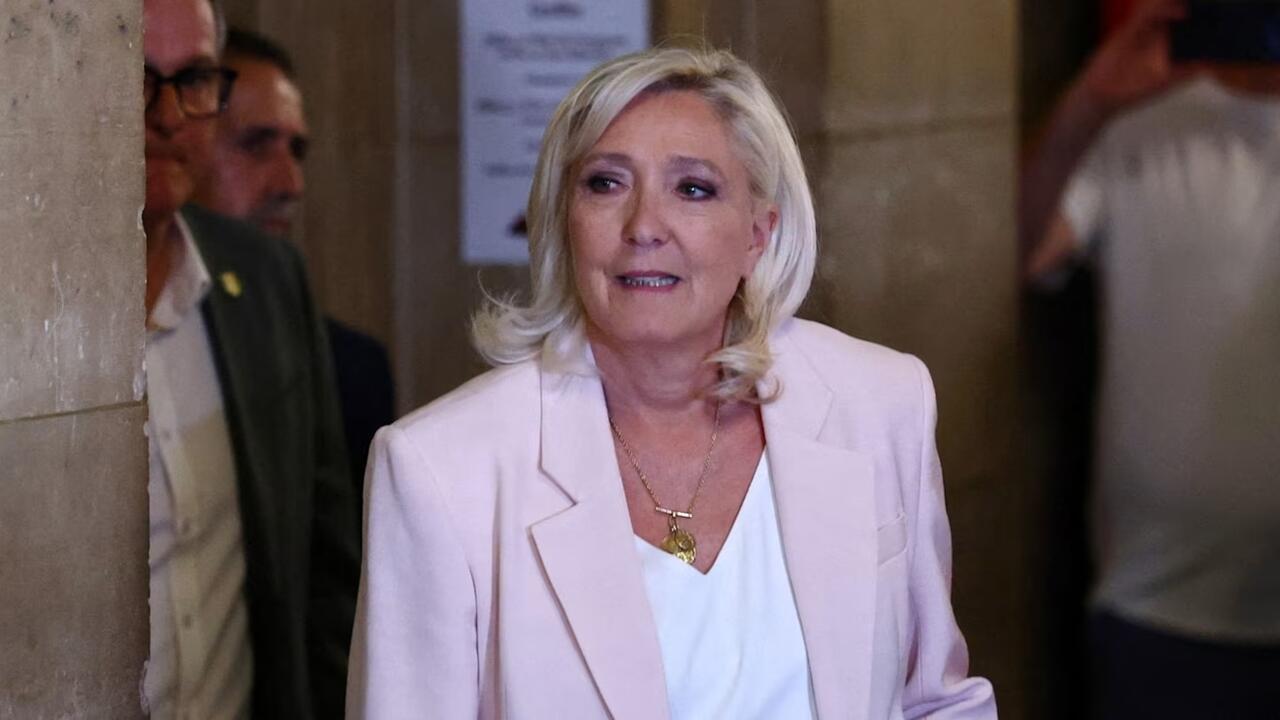
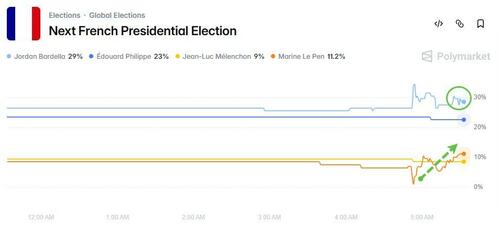
- Elsewhere on politics, EUR looks to the Paris Appeals Court ruling on Le Pen’s misappropriation scandal where she is expected to announce at 19:00BST whether she or Jordan Bardella will run in the 2027 French Presidential election as the candidate for National Rally (RN). To recap stances, POLITICO writes “Bardella appears more of a traditional economic right-winger”. While Le Pen has a “mix of right-wing nationalism on migration and left-wing social policies”. Despite the implications for French policy ING writes “we doubt this event has great market potential". EUR/USD -0.1% at 1.1428.
- Antipodeans are weaker against the Buck. Kiwi looks to the RBNZ tomorrow, where analysts and markets are divided on whether the Bank will hike, or keep rates unchanged (expectations biased to tightening). Westpac’s note this morning opined a relatively market-neutral scenario would be one where the OCR is unchanged and a tightening bias is retained. Meanwhile, Aussie is lacklustre and lacks direction.
Fixed Income
- A bearish session for fixed income thus far. The space has been driven lower by renewed energy upside, and while there was some relief from the very strong 30yr Japanese auction, benchmarks have since reverted back to session lows.
- USTs lower by 3+ ticks in 109-13+ to 109-22+ confines. Further downside brings into play 109-12+ and 109-12 from last week, before a handful of levels on the way to the figure and then 108-27 from June 11th. The US docket today begins with commentary from Fed’s Bowman before we turn to RCM/TIPP, the SCE and a 3yr auction, while on the lookout for commentary from President Trump.
- Bunds on the backfoot, lower by around 30 ticks and the marginal underperformer. Specifics include potential updates to the draft parental savings reform, according to Politico sources. Reforms aim to save around EUR 1.6bln/yr, though it will take several years for that figure to be seen.
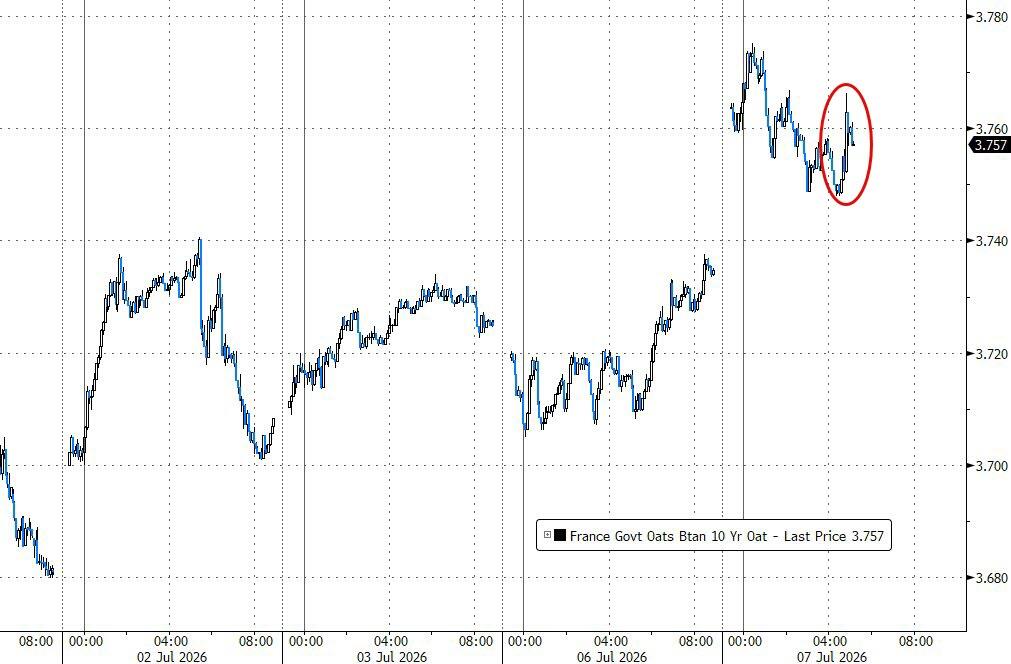
- OATs await their own political updates, heading into the Paris Appeals Court ruling on Le Pen’s misappropriation scandal. Following the ruling, Le Pen is expected to announce at 19:00BST whether she or Jordan Bardella will run in the 2027 French Presidential election as the candidate for National Rally (RN). Irrespective of the court ruling or the candidate, polling has RN leading into the 2027 campaign.
- Gilts opened relatively contained, but saw some choppiness after the BoE FSR. Gilts spiked higher by around 10 ticks, as the BoE is looking at easing some capital rules. However, as the release does not point to a carve-out or similar for Gilts, the move has unwound with Gilts a tick or two beneath pre-FSR levels. Currently down by c. 25 ticks, and holds within a 88.42 to 88.87 range.
- UK sold GBP 4bln 4.125% 2033 Treasury Gilt: b/c 3.16x (prev. 3.38x), average yield 4.519% (prev. 4.550%), tail 0.2bps (prev. 0.2bps).
- Japan sold JPY 454.9bln 30-yr JGBs; b/c 4.55x (prev. 2.94x, strongest demand since 2019), and average yield 3.993% (prev. 3.860%).
- Germany sold EUR 1.318bln vs exp. EUR 1.5bln 1.30% 2027 Green Bobl & 2.60% 2041 Green Bund.
Crude Benchmarks
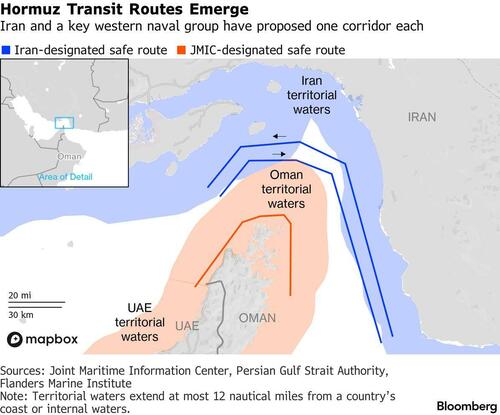
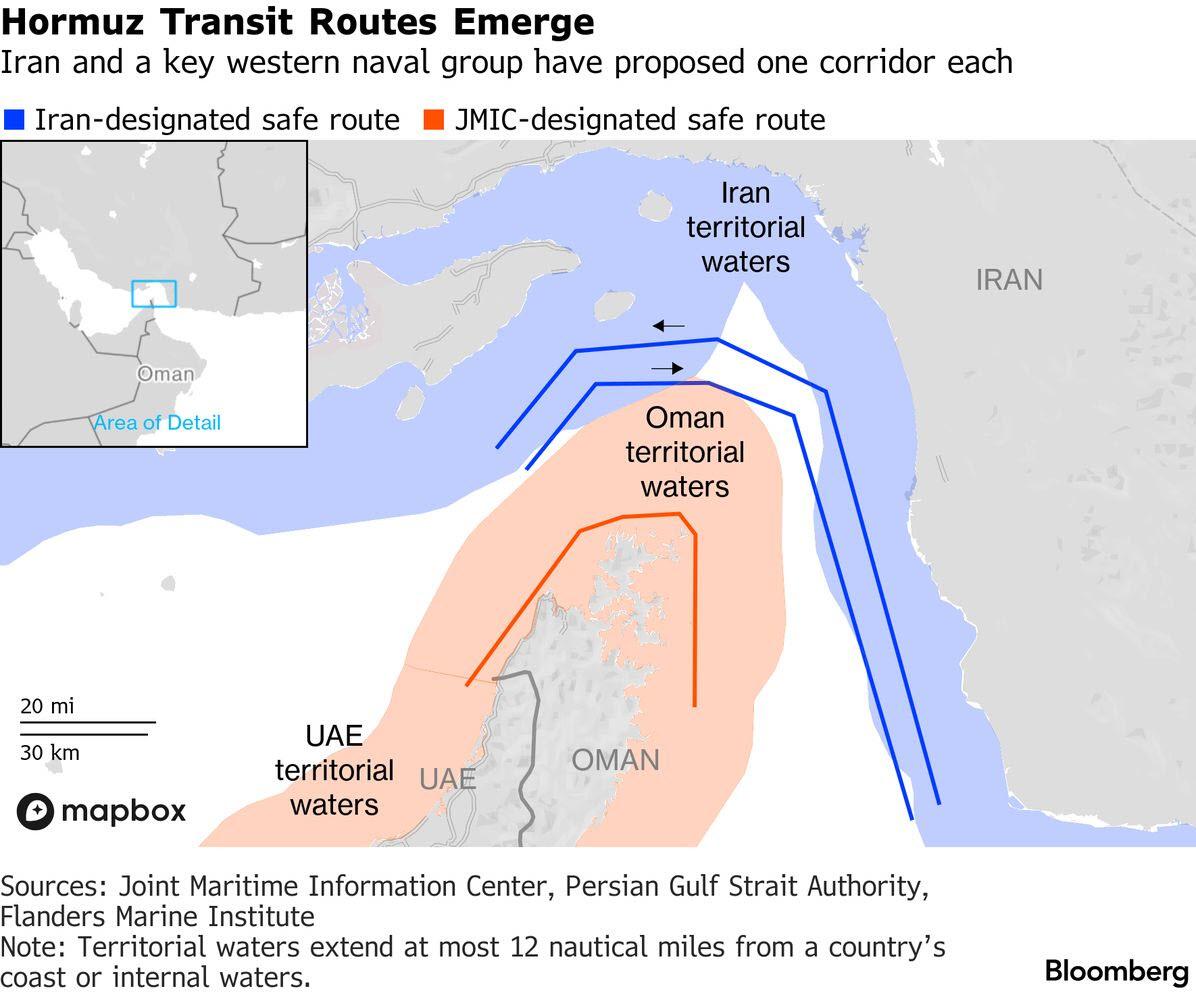
- Crude benchmarks are firmer this morning, having gradually moved higher throughout the APAC session. Action which has been facilitated by reports that Iran’s IRGC fired at least two missiles at ships in the Strait of Hormuz, with one said to be a Qatari LNG tanker another reportedly Saudi-flagged. Fars clarified that the Qatari tanker attempted to pass through the Omani route and ignored repeated warnings.
- As it stands, for as long as ships continue to sail through the Strait, the crude complex can remain towards recent lows. Therefore, the mild upward bias seen in the complex this morning appears to be some pricing in of some risk of a wider-escalation, but not another long-term disruption. Brent Sept’26 (+1.2%) currently holds just off the day’s highs, and within a USD 72.04-73.1/bbl range.
- Spot gold (-0.9%) is on the backfoot this morning, and trades at the lower end of a USD 4,116-4,168/oz range; the trough today marks the WTD low. Pressure today appears to be a bit of unwind of the strength seen in the prior week, and amidst the slightly firmer USD/firmer yields. For gold specifically, China extended gold purchases for the 20th straight month. China’s gold reserves at the end of June 2026 were 75.44 million troy ounces. Elsewhere, base metals are mixed vs broadly lower overnight. 3M LME Copper is currently flat and trades within a USD 13,325.13-13,427.2/t range.
- Saudi Arabia is said to be planning to expand East-West crude oil pipeline capacity by up to 2mln BPD to increase exports via the Red Sea, according to sources. Project aims to reduce reliance on the Strait of Hormuz.
- Kazakhstan Energy Ministry said it is trying to fulfil its OPEC+ obligations, while hoping to maintain production plans for 2026.
- China has reportedly purchased more soybeans from the US, Bloomberg reported; Cofco has booked at least 6 cargoes for loading between Sep-Oct.
- Germany plans emergency gas reserve for up to EUR 1.5bln plus operating costs, according to sources.
- Hong Kong chief executive confirms the launch of central clearing system for gold.
- Data shows that two Japanese-owned supertankers carrying Saudi crude are transiting through the Strait of Hormuz to exit the Gulf region.
- Shanghai Gold Exchange has agreed to admit Hong Kong Precious Metal Central Clearing System as an international member.
- Syrian President Shala said the government has signed energy-sector contracts to add around 5k MW of generation capacity and rebuild power plants and is drafting plans to rebuild and modernise state institutions.
Trade/Tariffs
- Democratic State AGs object to US President Trump's plan to impose tariffs of up to 12.5% on 60 countries over forced labour concerns.
Central Banks
- ECB said it gives Euro Zone banks until October 31 to draw up plans against AI-powered attacks.
- ECB's Panetta said the latest energy shock does not compare to 2022.
- PBoC injected CNY 10bln via 7-day reverse repos with rate maintained at 1.40%.
- PBoC set USD/CNY mid-point at 6.8054 vs exp. 6.7838 (prev. 6.8066).
- PBoC Governor Pan said monetary policy maintains a supportive stance, will be increasing the southbound bond connect quota to CNY 800bln from CNY 500bln. To support more good companies to list in Hong Kong. Will keep increasing China's FX reserves allocation in Hong Kong. China will support Hong Kong to launch CNY-denominated commodities futures trading.
Geopolitics: Russia-Ukraine
- Russia's Defence Ministry said 452 Ukrainian drones have been shot down over the regions since Monday evening.
- A Russian governor said a fire has broken out at an industrial enterprise in the Kaluga region after a UAV attack.
- Russia's Moscow Mayor said a drone attack on Moscow has been repelled and emergency services are responding to debris, Interfax reported.
Geopolitics: Middle East
- UKMTO received a report of an incident 8NM East of Limah, Oman, with the tanker reportedly hit by an unknown projectile and causing a fire.
- Iran’s IRGC fired missiles at two commercial ships near the Strait of Hormuz early Tuesday, according to the WSJ citing a senior U.S. official. One of the vessels was an LNG tanker owned by the shipping arm of Qatar's LNG industry.
- Iran's IRGC fired at least two missiles at ships in the Strait of Hormuz, a US official tells Axios' Ravid; Two commercial ships were hit and suffered significant damages but no casualties.
- A Saudi-flagged crude oil tanker was reportedly damaged near Oman around the Strait of Hormuz after another LNG tanker was struck in the same area.
- The Qatari oil tanker was planning to pass through the Omani route in the Strait of Hormuz with the support of the US Navy and was attacked after ignoring repeated warnings, Fars reported citing sources.
- Iranian Foreign Minister Araghchi said negotiations on a final deal will not commence if threats continue.
- The European Aviation Safety Agency have extended the validity of the warning regarding flights over the airspace of the conflict areas in the Middle East and the Persian Gulf until July 8th.
- Lebanese President Aoun is preparing a visit to the White House to meet US President Trump before the end of July, according to Al-Nahar.
Geopolitics: Syria
- A series of explosive devices have detonated in proximity to the hotel in Damascus where French President Macron is staying, Reuters reported citing sources.
- "Al Arabiya correspondent: Macron's convoy left his residence in Damascus shortly before the explosion", Al Arabiya reported.
- French President Macron's motorcade left the hotel in Damascus around one hour before the explosions took place.
Geopolitics: Other
- China's coastguard said it lawfully expelled a Japanese vessel near Senkaku Islands.
- US State Department said China launched a nuclear-capable ballistic missile into the Pacific Ocean, urges China to engage in meaningful arms control discussions.
- Japan's military build-up and overseas aggression are a reality, not hypothetical and they are rapidly expanding pre-emptive strike and long-range attack capabilities, KNCA reported.
US Event Calendar
- 8:30 am: United States May Trade Balance, est. -78.4b, prior -55.9b
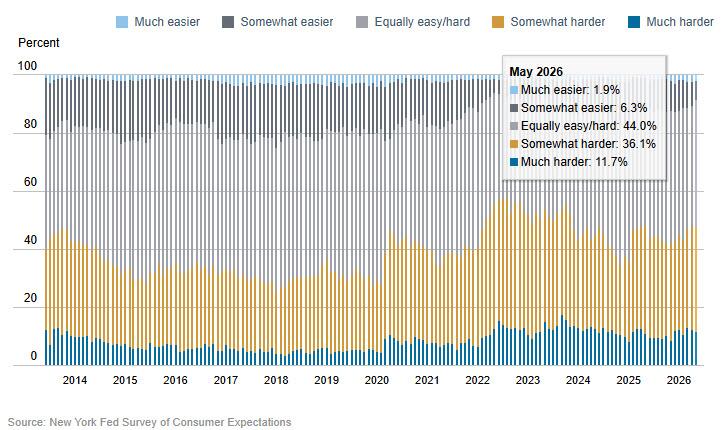
- 11:00 am: NY Fed Inflation expectations,
DB's Jim Reid concludes the overnight wrap
This year’s “Charts to make you go WOW!” pack returned yesterday for a 2026 edition. The chartbook is designed to surprise, challenge, and reframe the big macro and market stories of the moment. It’s become my favourite pack of the year to produce, and I hope you’ll enjoy and go “WOW!” at least once, and preferably a number of times. You can see it here at the Deutsche Bank Research Institute.
One theme in the pack is how astonishing moves in the South Korean equity market have been over the last year. This morning the extreme volatility continues with the KOSPI down -8.03%, with Samsung Electronics -9.3% lower, despite reporting a 19-fold increase in quarterly profit. Results were "only" 6% ahead of estimates and it seems to have brought in a bout of profit taking. The other KOSPI heavyweight SK Hynix is down -10.0% following the official launch of the marketing process for its planned US listing. Other tech heavy Asian markets are also lower with the Nikkei down -1.84%. Nasdaq futures are -1.03%, dragging the S&P equivalent -0.30% lower too. Elsewhere, the CSI and the Shanghai Composite are -0.83% and -1.04% respectively. Additionally, the Hang Seng (-0.42%) and the S&P/ASX 200 (-0.44%) are trading moderately lower.
In other corners of the market, Japan’s 30-year government bond auction saw its strongest demand since 2019, with a bid-to-cover ratio of 4.55, up from 2.94 previously and above the 12-month average of 3.41, as higher yields ahead of the auction attracted investors. JGBs are fairly flat on the day now.
Before all that, markets put in a decent performance yesterday, with a generally quiet session as the US reopened after the holiday. On paper the headlines were pretty decent, with the S&P 500 (+0.72%) hitting a 3-week high thanks to a rebound in chip stocks, closing back within 1% of its record high. But under the surface, things weren’t quite as robust as they seemed. For instance, most of the S&P’s constituents actually fell on the day, as it was primarily the chip rally that lifted the index higher. Moreover, some of that US strength was just a post holiday catch-up to last Friday’s global performance. So over in Europe (which was open on Friday), the STOXX 600 fell -0.35% instead, and the 10yr bund yield (+1.3bps) rose as well.
In the meantime, US Treasuries also saw a modest rally yesterday as they returned after the holiday, with the 2yr yield (-2.7bps) down to 4.11%, whilst the 10yr yield (-1.4bps) also fell modestly to 4.47%. That came as we heard from Fed Governor Waller later in the session, who argued that the risks facing policymakers have “completely flipped around” over the last year. Previously those concerns were focused on labour market weakness, but he said that employment conditions now appear to be stabilising whilst inflation has been “taking off”. As such, Waller made clear that the Fed's commitment to its 2% inflation target was unwavering, describing it as both credible and non-negotiable. And interestingly, market pricing for a July rate hike continued to creep back up again (after slumping on Thursday following the jobs report), with futures now pricing the chance at 25%. Meanwhile, Waller also stressed that the Fed would not keep rates artificially low to help finance growing US fiscal deficits, a timely comment given ongoing concerns around the US debt trajectory and the prospect of persistent budget shortfalls.
Waller's comments also fed into the increasingly lively debate on central bank communication. He said he’d personally prefer an inflation target range rather than a precise point target, but he acknowledged that adjusting the framework now would risk undermining credibility. And on forward guidance, he argued that if the Fed's reaction function is clearly understood, policymakers shouldn’t need to say very much about the future policy path. Interestingly, he interpreted recent comments from Fed Chair Kevin Warsh at Sintra about the demise of forward guidance as a reaffirmation of the primacy of the 2% inflation target rather than a shift in regime.
Whilst rates were subdued, things were a bit more eventful on the equity side, with the Philly semiconductor index (+2.17%) recovering after last week’s decline. That included a decent gain for Broadcom (+3.73%), which followed the news that they’d be partnering with Apple (+1.31%) on developing new custom chips, with an expanded partnership that will now go through 2031. So that helped to lift the S&P 500 (+0.72%), which closed back within 1% of its record high. With the tech sell-off in Asia we'll see how much of this reverses today.
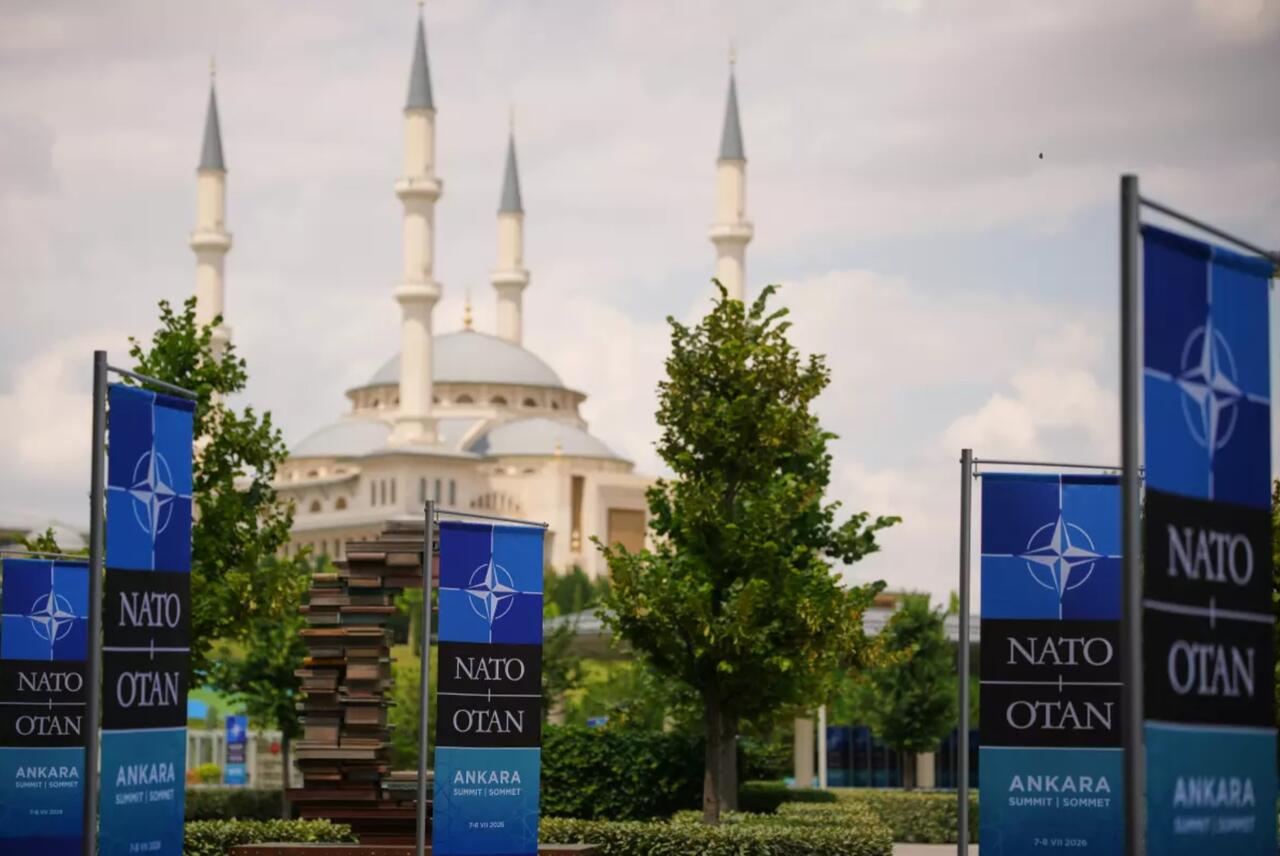
Looking forward, one of the main highlights this week will be the NATO leaders’ summit, which is taking place today and tomorrow. Given President Trump’s recent criticisms of NATO, particularly around the Iran conflict, it could be an eventful one, and this summit is expected to advance the emerging “NATO 3.0” agenda, under which European NATO members take on more responsibility for their own conventional defence.
Earlier in Europe, markets struggled by comparison, with equities and bonds both selling off. In part, that followed hawkish comments from the ECB’s Schnabel, who said that the peace deal didn’t mean they were back to the pre-war situation, pointing out that gas prices “are still around 40% higher than before the war.” So investors grew more confident that the ECB would still hike rates this year, with markets now pricing in an 89% chance of a hike by the December meeting up from around 70% last Thursday after Sintra. And in turn, yields moved higher on the day, with those on 10yr bunds (+1.3bps), OATs (+1.1bps) and BTPs (+0.9bps) all rising. Equities lost ground too, with the STOXX 600 down -0.35%, although Germany’s DAX (+0.15%) outperformed modestly yesterday. There appears to be growing optimism that Germany’s recent reform announcements may finally translate into something meaningful, particularly when combined with the significant fiscal stimulus unveiled last year. Enthusiasm for the German trade faded towards the end last year, with the Iran conflict adding another layer of uncertainty. However, some green shoots of optimism now seem to be re-emerging.
Staying in Europe, today is the day we find out, via a key court ruling, whether Marine Le Pen will be eligible to stand in next year’s French presidential election.
Amidst everything else, we did get a few data releases yesterday, but they didn’t provide much excitement. Indeed, the ISM services index for June was exactly in line with consensus at 54.0. And there wasn’t much of a story to write from the subcomponents either, as the prices paid reading was also broadly as expected at 67.7 (vs. 67.5 expected). So the direct market reaction was pretty limited, although there was some relief after the employment component (51.2) was back in expansionary territory for the first time since February.
Looking at the day ahead now, data releases include German industrial production and the US trade balance for May. From central banks, speakers include the ECB’s Panetta and Kocher, whilst the BoE will release their Financial Stability Report. Otherwise, the NATO leaders’ summit begins today.
Tyler Durden
Tue, 07/07/2026 - 08:31

 via Reuters


 Getty Images


 via Associated Press
Recent comments