Fauci Files: A Megalomaniacal Egomaniac Milking Covid For Everything It's Worth
Authored by Tom Elliott via Substack,
On May 28, 2021, Anthony Fauci learned that the Department of Health and Human Services would refer EcoHealth Alliance - the New York nonprofit that had routed NIAID money to the Wuhan Institute of Virology - to its inspector general. That night he wrote in his diary:
"I am certain that there will be some deficiencies that the IG will find as is always the case with IG audits. Certainly, whatever they find it will be misconstrued by those who want to make a case for our involvement in the outbreak. I am starting to feel that it is important for me to write an editorial or an opinion piece giving our side of the story." (p. 753)
Our involvement in the outbreak. Followed closely by a plan to get out in front of it.
That instinct - get ahead of it, control the story, decide what the public needs to believe and then saturate every channel with it - is the organizing principle of these documents. It shows up in the origins fight. It shows up in masks, transmissibility, and boosters. It shows up in how he handled the people who disagreed with him. And it shows up, most revealingly, in what he chose to write down.
What was released
On July 24, Senator Rand Paul's committee published two documents that have not been reported in any depth.
The first is Fauci's personal diary, 1,141 pages, running from late 2019 through his retirement in December 2022. It is partly a journal and overwhelmingly a scrapbook: he pasted hundreds of articles about himself into it, frequently in full.
The second is 136 pages of internal email about his awards - nominations, ethics clearances, and the disposition of prize money.
Fauci does not date the composition of his entries, so we cannot always distinguish what was typed the same evening from what was assembled later. Page numbers refer to the released PDFs.
I. What they thought at the start
Page 13 of the diary covers two important events from January 31, 2020.
The first is that Fauci is handed the mic to serve as Covid's point person. He writes:
"White House is now fully convinced that I be the science/health spokesperson for the USG. Bob Redfield just does not come across very weel. He takes forever to say something and it is usually wondering. This drives the WH and HHS comms people crazy and so they are putting me out on all the requests."
The director of the CDC was not sidelined for being wrong, but for being slow on camera. The selection criterion was not who's the most credible scientist, but who performs best on TV.
Redfield's own account of that period, given under oath in 2023, is worth recalling. Asked why he had been excluded from the origins discussions, he pointed to ideological differences: "Because it was told to me that they wanted a single narrative, and that I obviously had a different point of view."
The second thing happens after he gets back to his office. Jeremy Farrar of the Wellcome Trust calls, sounding "very concerned," with Kristian Andersen of Scripps conferenced in and Eddie Holmes in the background from Sydney. Fauci writes down what they told him:
"The people on the phone felt that the mutations around the furine cleavage site of the spike protein could not have occurred naturally since it would require an evolutionary 'jump' that they found nowhere in bat isolates."
Deliberate insertion, they said, followed by release - accidental release being the most likely.
The next day Fauci convened a larger call of twelve experts in epidemiology. His entry characterizing it (p. 14) is the probably the single most consequential paragraph in the whole diary. There was "not total agreement about the likelihood of deliberate insertion," he writes. Ron Fouchier was certain it could have arisen naturally and said they shouldn't waste time. Christian Drosten agreed with Fouchier. And then, in Fauci's own words:
"the rest felt that deliberate insertion was possible."
Ten of twelve thought it must be manmade. And he admits the person driving the zoonotic theory perspective, Ron Fouchier, was "expected of him since he was the original GOF [gain of function] person with Yoshi Kawaoka."
II. What happened next
Three days later, four of the scientists from that call were circulating a draft arguing the opposite. "The Proximal Origin of SARS-CoV-2" appeared in Nature Medicine on March 17, concluding that the virus was not a laboratory construct. Andersen told the journal in his cover note that the paper had been prompted by Fauci and Francis Collins. Drafts went to both men before publication. Fauci's reply to Andersen: "Nice job on the paper."
Two months after Proximal Origin published - Fauci's institute approves an $8.9 million grant for Andersen.
On April 16, Collins wrote to Fauci asking whether NIH could help "put down this very destructive conspiracy." The following day, Fauci cited Proximal Origin from the White House briefing room podium - the most watched platform on earth at that moment.
Three weeks after that, on May 4, 2020, he told National Geographic that the evidence was "very, very strongly leaning toward this could not have been artificially or deliberately manipulated," citing "a number of very qualified evolutionary biologists."
The doubt referenced in his diary never reached the public.
And his account of that February call has never stopped changing.
A June 7, 2021 diary entry (p. 767), recounting the same meeting: "About half of the people felt that this was possibly a constructed virus and the other half were convinced that this was a natural occurrence."
In a June 3, 2024 sworn opening statement to the House Select Subcommittee, Fauci said he joined a call with about a dozen international virologists, that the discussion was "lively, with arguments for both possibilities," and that after further examination several who had been concerned about lab manipulation became convinced the virus was not deliberately manipulated.
The June 2021 retelling contains another problem: he says "a few weeks later" Andersen and colleagues re-examined the data and concluded natural origin. The draft was circulating on February 4 - three days after the call. The June 2021 entry shows how he's trying to mould history into something different for posterity.
III. Habit becomes routine
Origins is where this pattern is most consequential, but it is not where it started or where it stopped. The diary shows the same strategy applied to every contested question of the pandemic: decide what the public needs to believe, then flood the zone.
Consider masks. Fauci's public reversal in the spring of 2020 is well known, and he has explained it as a response to shortages and to emerging evidence on asymptomatic spread (p. 375). But watch what happens when the question comes back around in February 2021, when he begins pushing double-masking (p. 619):
"CDC starting to do practical things that I have actually been pushing for some time. For example: Wearing 2 masks could be better than just one. They did a dummy study and showed that a cloth mask over a surgical mask actually gives a more complete fit and keeps out aerosols."
Note the order of operations: He had been pushing it "for some time," the evidence arrives afterward, and the evidence is a mannequin. That is the entire evidentiary basis for double-masking in a 1,141-page diary kept by the government's chief spokesman on the subject during the month he was urging 330 million people to adopt it.
We see every time Fauci is turned to for guidance, he makes bold proclamations without feeling burdened to verify any scientific basis. We see it in the numbers.
Across 1,141 pages by the nation's senior infectious disease official during the largest public health event in a century, here is how often certain terms appear.
Never once: "peer review." "Meta-analysis." "Risk-benefit." "Learning loss." "Mental health."
Once: "N95." "Seroprevalence." "Cost-benefit."
Twice: "Cloth mask." "School closure." "Natural immunity."
Against which:
- "Award" - 80
- "Hero" - 49
- "Instagram" - 36
- "Bobblehead" - 23
- "Selfie" - 19
- Entries headed "PRESS:" - 641
The question of whether prior infection conferred meaningful protection - the question underpinning the vaccine mandates that cost people their jobs - is never worked through anywhere in these pages. It appears twice, both times as an attack to be repelled.
IV. The flex
What the diary contains instead of evidentiary reasoning is an extraordinarily detailed record of influence.
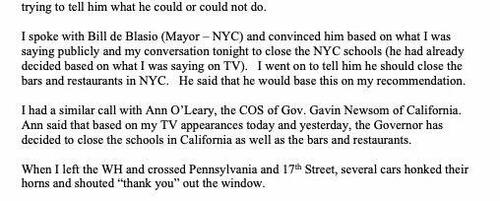
March 15, 2020: Fauci records calling Bill de Blasio and convincing him to close New York City's schools, then telling him he should close the bars and restaurants, too - de Blasio "said that he would base this on my recommendation." He records a parallel call with Ann O'Leary, Gavin Newsom's chief of staff, who tells him that based on his television appearances, California will close its schools, bars, and restaurants. He records walking out of the White House to drivers honking their thanks. The next morning, federal guidelines emerge "that reflected my pushing for a more aggressive mitigation 15 day strategy."
So here we have Fauci humble bragging about shutting down the largest city and state in the country, via leverage that was entirely a function of being the man Gov. Newsom & Mayor de Blasio watched on TV.
His impact extended beyond the continental United States. Israeli Prime Minister Naftali Bennett requested a Zoom to secure Fauci's "opinion and ultimate support" for Israel's booster program, recorded it for his own Instagram, and asked for Fauci's cell number so he could "intermittently call me for advice"; with State Department approval, Fauci gave it (p. 830). The presidents of Ecuador and Chile called. So did health ministers in Brazil, Gabon, Israel, and Quebec.
The MLB commissioner wanted guidance on spring training; the NHL players' union wanted projections (p. 507). Bill Gates had a standing biweekly slot. Coach K, on a podcast, called him "the point guard for the world," and Fauci wrote it down (p. 83).
Then there is the CDC, which he seemed to be furtively running through his cellphone.
May 13, 2021: Rochelle Walensky calls to say she is changing the mask guidance for vaccinated Americans. Fauci: "She will take my advice ... I'm very pleased that she listened to me." Then the tell - "The radical right-wing maniacs who blamed me for the rigidity of the CDC recommendations will probably not realize at all that it was me that triggered this change" (p. 736).
September 2021: the CDC's independent vaccine advisory committee votes 9-6 against the booster recommendation the White House wants. Fauci, the White House's Jeff Zients, Surgeon General Vivek Murthy, and Leslie Dach - a Democratic operative who founded the advocacy group Protect Our Care - work the phones. Fauci texts Walensky and, in his own words, "begged her to override" the vote. She calls back at 11:25 p.m.; he misses it; they speak at 5:40 a.m. His entry: "Alas! Rochelle listened to me. She overruled the recommendation of the ACIP." He congratulates her on finally showing "clear leadership" (pp. 883-884, 887).
So, Zients had been calling him "multiple times per day asking me to continue to mentor Rochelle such that the CDC/ACIP does not veer too far off the FDA recommendations and our ultimate intent" (p. 880).
We can only guess what their "ultimate intent" is, but recall the context is loosening rules for those who've agreed to be vaccinated.
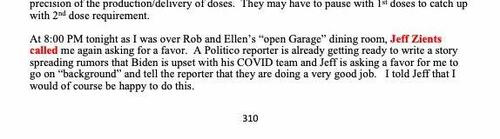
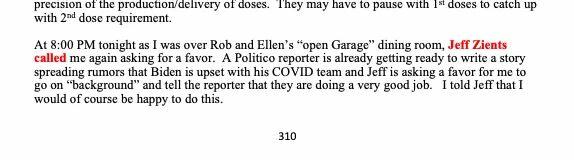
In January 2021, Zients called Fauci at dinner "asking for a favor" - a Politico reporter was preparing a story that Biden was unhappy with his COVID team, and Zients wanted Fauci to go on background and say otherwise. "I told Jeff that I would of course be happy to do this," Fauci wrote (p. 580). The next day: "I convinced them that the Biden team is a good team." In March, Zients wanted him "comfortable with" the CDC's forthcoming guidance for vaccinated people; Fauci reviewed it, decided the agency had loaded it with qualifiers, and "edited their document some what." Without a hint of irony, Fauci then adds: "Jeff was very sensitive in not having the White House interfere" (p. 642).
Here we have three nominally independent agencies, a White House coordination office, and a party-aligned outside operative, converging by telephone on predetermined outcomes, with the advisory committee that voted the other way treated as an obstacle to be routed around. This is the structure that enabled them to steamroll actual, data-driven scientists.
V. Threats to the structure
Real science requires dissent. But to Fauci, who once infamously likened himself to science itself, treated dissent as a danger to his entire enterprise.
Scott Atlas, the Stanford radiologist Trump brought onto the task force, generated an October 2020 email in which Fauci formally demanded his removal "from the Task Force and quite frankly from the White House itself" (p. 388). Days earlier, Fauci had recorded a meeting between Alex Azar and "Atlas and his 3 stooges" - Drs. Jay Bhattacharya of Stanford, Sunetra Gupta of Oxford, and Martin Kulldorff of Harvard (p. 390) - a week before those three published the Great Barrington Declaration. After a Good Morning America appearance that month, Fauci, trying to squelch these burgeoning critiques, congratulates himself: "I blew away the Great Barrington Declaration" (p. 406).
Richard Ebright, the Rutgers microbiologist who has been the most persistent scientific critic of NIAID's gain-of-function portfolio, is "truly an asshole" (p. 834); then a man pushing lab-leak because he "wants to be somebody" (p. 888); then "this complete idiot" whom Fauci resolves to handle in his memoir "since he really is a horrible person" (p. 906). In the same passage he writes that he is "terribly disappointed" in virologists Jesse Bloom and David Relman and believes they are "pushing for and even hoping that this was a lab leak."
Then April 2021 (p. 695), David Morens has told Fauci that people are trying to "bring me down." Fauci takes umbrage that these critics have received funds from the agency he was running: "It is my suspicion that some of these so-called NIAID grantees are Imperiale and Rich Ebright."
He notes that both have publicly claimed he would cut their funding for criticizing him, calls that preposterous - then closes the entry: "Let us see if in fact these are the villains."
You can only imagine him as Inspector Gadget gently stroking his cat as he typed those words.
VI. Fauci's colleagues, the press
The most revealing aspect of these pages are how Fauci worked with compliant "journalists" to shape media narratives. On July 26, 2020, while watching Brett Giroir - the assistant secretary for health and a fellow member of the White House task force - be interviewed on CNN's State of the Union, Fauci writes that Giroir was "talking bullshit about testing with Jake pressing him." Then (p. 263): "I gave Jake some questions to ask him."
So, a senior federal official is trying to undermine a rival federal official, using a CNN anchor as his conduit.
The diary records CBS's chief medical correspondent, Jon LaPook, emailing Fauci over a weekend "to prep him for his interview" before going on air, then cited Fauci repeatedly during it (p. 2). LaPook later produced the admiring 60 Minutes profile Fauci credits with driving Trump "over the edge."
Fauci even got stories killed, at least according to his telling: In January 2020, the Washington Post's Lena Sun called to check a tip that Beijing had leaned on the WHO's director-general to delay declaring an emergency; Fauci told her it was nonsense and wrote, "I probably stopped her from writing the story" - noting that Sun had come to him because he is "in all the important meetings" (p. 7).
Members of the corporate media make many embarrassing cameos in these pages: Jake Tapper sends Fauci a text making fun Laura Ingraham's intelligence (p. 113) and twice hosts Fauci for dinner at their family home (p. 420); George Stephanopoulos texts after an interview, "Thank you, Tony. So impressive" (p. 264); Andrea Mitchell calls his cell, apologetic, having assumed he had declined her show rather than been blocked from it (p. 235); Jimmy Kimmel writes his TIME 100 citation in the year he was ranked first among "Leaders," another puff piece he saves for his scrapbook (p. 357).
The pattern becomes easy enough to understand: He supplied access and the guise of expertise, they supplied a platform and a halo, and the arrangement was load-bearing enough that when a reporter got a genuinely hard tip about the WHO and China, she brought it to him before she wrote it.
VII. The scrapbook
Which brings us to what the diary mostly is: 641 entries in these pages are labeled "PRESS:" - lists of the day's media appearances, often a dozen at a time, frequently followed by the articles themselves transcribed in full. A senior scientist's pandemic journal turns out to be, by volume, a clipping service devoted to his favorite subject: himself.
The tone of what he preserved is worth registering. He kept the Washington Post column comparing a Rand Paul cross-examination of him to "watching Albert Einstein being disputed by his dry cleaner." He kept the Joan Baez portrait and her calling him an American hero (p. 292). He kept the cookies from Joe and Jill Biden with the note "You are our hero" (p. 175), and Julia Roberts gasping on an Instagram livestream that he was her personal hero, and Marian Wright Edelman calling him "a true national treasure" (p. 1113), and Beth Cameron of the NSC texting that he was her hero for what he did with Rand Paul (p. 815).
By my count he records someone calling him a hero at least 10 times across three years.
He recorded a standing ovation he could not see because he was attending by Zoom, noting in the same passage that it would be his 58th honorary doctorate and that Holy Cross was naming a science complex after him (p. 951). He recorded a Seattle Mariners crowd's ovation three separate times in one entry - claiming his opening pitch was "perfect" - alongside a complaint that the Washington Examiner had reported some fans booing (p. 1,020). He recorded being "totally mobbed by my colleagues wanting selfies. I must have done at least 100 (no exaggerating!)" (p. 1084). When the Infectious Diseases Society of America established a perpetual Anthony S. Fauci Prize, he transcribed the entire citation (p. 1086).
And then there is the second document Sen. Paul's office released, which shows that a good deal of this was not happening to him. Our tax dollars were helping arrange it.
In October 2018 - 14 months before any of this - Barton Haynes of Duke nominated Fauci for the Shaw Prize. Fauci wrote back the same day (Awards, p. 2):
"Thanks, Bart. There is another one that looks possible for me if you are willing to do it. As usual, I will supply all of the material. It is the Dan David Prize."
As usual? Four days later he pitched a third and wrote the strategy himself (p. 4): the Heinz Award, category "The Human Condition," using the PEPFAR record - "We obviously will take care of all of that on my end." He coached Haynes through qualifying as a nominator, noting the "minor glitch" that the Heinz people require a CV first "because they do not want just anyone nominating anyone." He tracked prize calendars like a portfolio, telling Haynes to stand down on the Dan David until "medicine/science returns as a theme" (p. 5). He collected it two years later.
The Dan David Prize - $1 million, headquartered at Tel Aviv University - announced Fauci as its 2021 public health laureate on February 15, citing his "courageously defending science in the face of uninformed opposition." None of the coverage mentioned that the nomination pipeline had been running since 2018 with the laureate supplying the materials.
Every message in the awards file copies NIAID staff, who assembled packages, chased clearances, and eventually arranged a wire transfer. NIH's ethics counsel was described by her own superior as playing "the seminal role in assembling of the award packages" (p. 19). (Which sounds like the opposite thing an ethics counsel should be doing.) That superior was Lawrence Tabak, then NIH's principal deputy director, who personally wrote to HHS General Counsel arguing across several pages that Fauci should be allowed to keep the $40,000 attached to a National Academy of Medicine award - invoking the Academy's 1863 charter, a 1997 amendment to the Federal Advisory Committee Act, and a Congressional Research Service report (p. 30). Days earlier Tabak had written to Fauci about the delays: "my goal is to support you in the strongest possible way" (p. 18).
When the Dan David Prize cleared on April 9, 2021, the internal traffic was preserved (pp. 120-121). Arthur Bennett: "At last!!!!!!!" Patricia Conrad, forwarding to Fauci: "Congratulations....you're rich!" Greg Folkers: "I want my 15%."
We know the sum to the penny because Fauci corrected his own financial disclosure the following spring (p. 135): "The Dan David prize that was deposited in my bank account was $899,960.00, not $901,400."
Technically soliciting one's own nomination is not illegal, and in elite science it is not even unusual - most major prizes require a qualified nominator. But here we have some pretty well-scaled machinery: a federal agency's staff and the NIH's chief ethics counsel running a standing campaign, a legal argument built at the deputy-director level so a cash prize could be retained, and roughly $900,000 landing in the personal account of a sitting official who had arranged the nomination that produced it.
The final verdict
These two document dumps go a long way helping us understand how the sausage is made.
The White House needed a face that performed well under lights; governors needed cover for decisions they had half-made and took it from a man whose authority came from TV hits rather than peer-reviewed studies; a press corps needed access and a protagonist and traded a halo for both; a White House coordination office needed a scientist willing to serve as an anonymous source, edit another agency's guidance, and lean on another agency's director when her experts voted wrong. Foreign leaders needed the imprimatur of Official Science on a phone call. NIH's own leadership needed the world's most famous scientist happy, and built him the legal argument to keep his bank account flush.
And Anthony Fauci got the largest edifice of public esteem ever assembled around an American civil servant - much of which, it turns out, he had personally arranged the scaffolding for, starting 14 months before the first case of Covid.
Fauci's blast zone was wide: On a public told that guidance was science when the diary records it as message discipline and mannequin studies; on three highly credentialed academic epidemiologists who found themselves recorded as stooges; on a CDC director cut out of briefings on her own agency's guidelines; on an advisory committee whose 9-6 vote was reversed by telephone before dawn; on international agencies leaning on U.S. officials for guidance, on everyone who lost a job over a mandate ...
The story began with Fauci acknowledging his own panel of experts virtually unanimously agreed Covid was manmade, before shifting to the elaborate effort put into convincing the world otherwise. Throughout it all, we see little discussion or concern about the humanitarian impact of anything they're doing. Instead we see a craven egomaniac milking it for all it's worth.
* * *
Both documents are public at paul.senate.gov: the diary at 1,141 pages, the awards correspondence at 136. Page citations refer to the PDFs as released; word counts are raw string searches of the extracted text and include pasted press. Quotations preserve original spelling. Dr. Fauci's representatives were contacted for comment.
Tyler Durden
Sun, 07/26/2026 - 18:20

 The Muwaffaq Salti Air Base in Azraq, Jordan, which has come under attack of late. via X/The Week


.jpg)
Recent comments