The November 2010 monthly unemployment figures are out. The official unemployment rate increased to 9.8% and the total jobs gained were 39,000, with 39,500 of those jobs being temporary. Yes, you read that right, there were more temporary jobs created than the finally tally of jobs. Total private jobs came in at +50,000, in stark contrast to the 93,000 ADP reported.
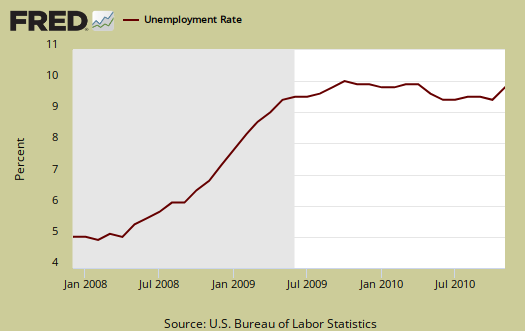
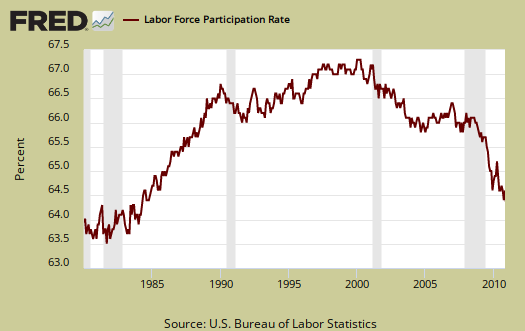
Those added to not in the labor force was +82,000. The labor force participation rate unchanged at 64.5%. This is the lowest labor participation rate since 1984. U6, or the broader unemployment measurement, is still 17.0%.
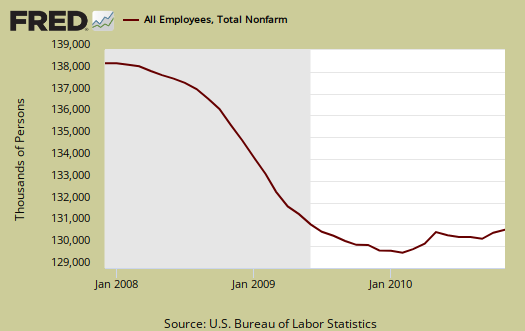
Below is the nonfarm payroll, the total number of jobs, seasonally adjusted. Since the start of the great recession the United States has officially lost 7.412 million jobs.
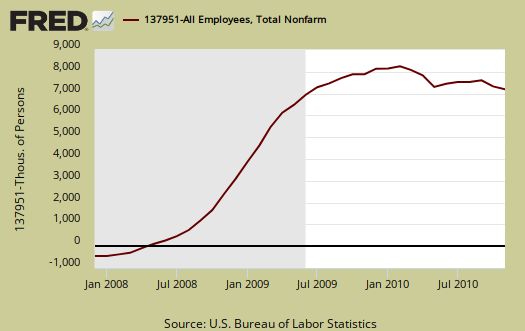
Below is a running tally of how many official jobs permanently lost since the official start of this past recession (recall the private NBER has declared the recession over!). This is a horrific tally and notice this isn't taking into account increased population growth.
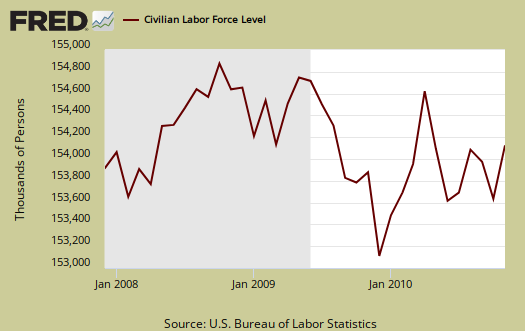
How can the unemployment rate increase? Because the United States working age population increased.
The civilian labor force increased by 103,000. Of those still in the civilian labor force, employed, decreased by -173,000 in November, yet those unemployed swelled to 276,000. Those not in the labor force increased by +82,000. What we see here are people simply dropping out of the count (82,000) and more people entered the labor force...looking for work. Yet because there were no jobs, we can see those additional people added to the official unemployed tally.
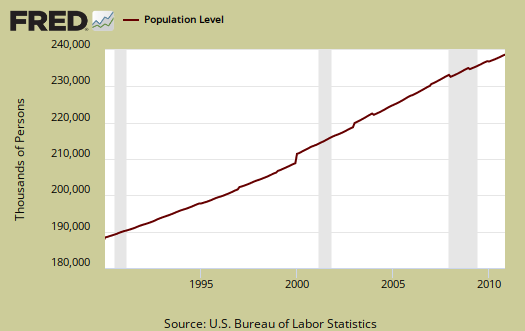
The civilian non-institutional population rose by 185,000 last month. The civilian population now stands at 238,715,000. Yet those not in the labor force are now an astounding 84,708,000. An horrific 15,119,000 people of the official tally are out looking for work. 2 million of these people are about to be cut off from unemployment benefits.
390,000 people lost their job last month, officially fired with 105,000 of them being booted from temporary jobs. Then only 8,000 people quit. This means very few people will dare quit a job these days. Of those unemployed the number of re-entrants, or people trying again, decreased by -61,000. New entrants into the job market who don't have a job also decreased by -35,000.
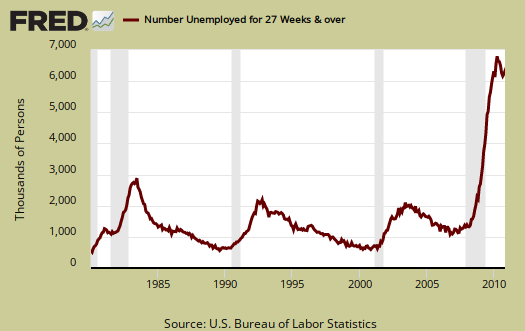
The long term unemployed (> 27 weeks) increased by +107,000. 42% of the official unemployed have been so for 27 weeks or longer. But because we see no real job growth, this implies people are dropping from the count.
- Long term unemployed - 6,313 million
- Forced Part Time - 8,972 million
- Marginally attached to the labor force - 2,531 million
Of the Marginally attached, 1,282 million are discouraged. While forced part-time dropped -182,000 this month (which should be good because these are people whose hours were cut), the marginally attached, or those not counted but really wanting a job, increased 200,000 over the past year.
U6, defined as total unemployed, plus all persons marginally attached to the labor force, plus total employed part time for economic reasons, as a percent of the civilian labor force plus all persons marginally attached to the labor force, (table A.15), was 17.0%, the same as last month. This number is obscene.
One needs at least 175,000 and some estimate up to 300,000 permanent full time jobs, added each month just to keep pace with U.S. civilian workforce population growth. That's not general population, that's the group needing a job. To even get back to pre-recession unemployment rate levels we need a good 424,000 jobs created each month. That's permanent jobs. Even if the U.S. created 400,000 permanent jobs each month, it would take over 18 months to recover the jobs lost since January 2008, or the start of the great recession.
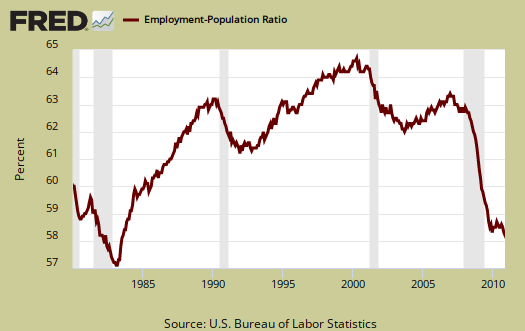
The civilian labor force participation rate was unchanged, at 64.5%. The employment to population ratio is now 58.2% also at record level lows. This isn't a structural change, such as all families decided to have a stay at home caretaker, or magically a host of people could retire early, this is people dropping out of the count.
These numbers are important because unemployment is a ratio, percentage or during a limited time period, the number of people actively looking for a job and counted. Many people are not counted in the official unemployment statistics, due to definitions, but obviously when one has more potential workers and less jobs, that metric doesn't bode well for America.
Below is the graph of the civilian non-institutional population, which is the largest super-set of the potential labor force, larger than the civilian workforce, due to those who are not looking for work, retired and so on being counted in this figure. It increased this month by 185,000. Except for some statistical adjustments, the monthly rate of change in civilian non-institutional population is a reasonably constant 1% population growth. This is why one must create jobs greater than the constant rate of jobs lost. There are more people to employ.
Unemployment is a percentage, a ratio.
The BLS unemployment report counts foreign temporary guest workers as well as illegal immigrants in their U.S. labor force statistics.
In looking over table B1 we can get a little more detail on what kind of jobs were created (and lost) on the permanent jobs front. Retail trade lost an astounding number of jobs and these were in the retail stores. What happened to all of those Christmas jobs so quoted in the press that were going to be made permanent? Did stores do a purge in November to labor arbitrage these workers?
Of Professional & Business Services, temporary jobs were 39,500. Construction literally wiped out it's last month's gains. Without temp jobs, the sector lost jobs.
- Financial: -9,000
- Information: +1,000
- Construction: -5,000
- Manufacturing: -13,000
- Mining & Logging: +3,000
- Health and Education: +30,000
- Leisure and Hospitality: +11,000
- Professional & Business Services: +53,000
- Temporary: +39,500
- Trade, Transportation, Utilities: -13,000
- Retail Trade: -28,100
- Government: -11,000
8,000 of the manufacturing job losses were in non-durable goods. Local government lost -14,000 jobs.
Bear in mind illegal workers and foreign guest workers are counted as employed Americans, which can distort occupational sectors, particularly the Science and Technology ones. Below are the unemployment rates per occupational sector from table A-14, not seasonally adjusted. Look at how high information, professional and business services is. Tell me offshore outsourcing is not having an effect again. The BLS claims jobs have been created in these areas, yet look at the unemployment rate. Something is wrong with this picture. Could it be foreign guest workers included in the job count?
- Financial: 6.7%
- Information: 8.8%
- Construction: 18.8%
- Manufacturing: 9.9%
- Mining & Gas, Oil: 8.5%
- Health and Education: 5.9%
- Leisure and Hospitality: 12.4%
- Professional & Business Services: 10.6%
- Retail, Wholesale Trade: 9.0%
- Government: 4.4%
- Agricultural: 14.5%
- Self-employed, unpaid family: 5.8%
You probably also want to know the birth/death model. What is that? It's a statistical adjustment to compensate for new businesses and dead businesses who are not actually tallied by data reports. Those jobs created and died outside the statistical reporting time window due to lag. So, the BLS estimates how many jobs can be attributed to those firms which are not actually counted. This month's adjustment was -8,000 jobs. Now one cannot directly subtract the birth/deal model monthly numbers, because unemployment data is seasonally adjusted, yet the birth/death adjustment is not seasonally adjusted, get that? Anywho, jobs attributed to new and dead businesses are just an estimate in so many words.
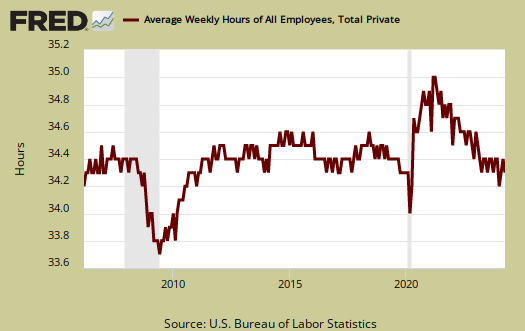
The average work week remained the same with private work work decreasing to 33.5. Average earnings (drum roll please), increased 1¢ to $22.75/hr. Take a look at how many industry sections are below full time hours. When the number of hours per worker is below full time, beyond the labor implications, there also is a common practice among employers to keep workers part-time, in order to deny them benefits.
Here is last month's report. The below revisions are improvements of the last two months previous. The number of jobs down from the start of the recession was calculated with these revisions included.
The change in total nonfarm payroll employment for September was revised from -41,000 to -24,000, and the change for October was revised from +151,000 to +172,000.
Note: In the BLS main text quotes +40,000 temporary jobs instead of 39,500. This is because they round up in the main report text.
Subject Meta:
Forum Categories:
| Attachment | Size |
|---|---|
| 226.43 KB |

The recovery myth!
This report is plain awful and shows, either the ADP is full of it or something is wrong with the BLS. I'd claim both methods just do not capture the true state of the U.S. workforce at this point, but regardless, this report is friggin' horrific!
There also is something very very wrong at this point in terms of hiring U.S. workers. I hope to write up more information on how this could happen. But a good indicator is more temporary jobs than total jobs and the fact most of America is part time!
Retail?
Robert how can retail be -28000. I wonder if we are in for a huge revision next month. I don't understand with positive growth signs this holiday season.
seasonal adjustments
but even without seasonal adjustments, Honestly I'm not sure and was very surprised to see that. Calculated risk shows temp seasonal is still below last year, but I haven't asked him where he got his temp retail trade hire data.
Either there is a major seasonal adjustment OR and this is more what I suspect, retail stored fired a ton of people before the holidays and then hired temps. but the stores with clear job losses are building, general merchandise.
But even if one looks at the NSA data, it's not a large job gain and I would think the norm on retail trade, at least most of the stores would be to increase perm hires too during their big quarter. Doesn't look like it.