Rummaging around for information regarding the average lead time for "leading economic indicators", I came across this 2005 article at Economist's View written by Catherine Baum who accurately called the banking crisis last year, explaining why economic forecasters are so often wrong:
The Index of Leading Economic Indicators [ ] isn't a bunch of randomly selected components .... The 10 components of the LEI were all chosen because of a demonstrated ability to predict future economic activity.
The index includes both financial (stock prices, the money supply and the spread between the funds rate and 10-year Treasury note yield) and real-side variables (building permits, capital goods orders and vendor deliveries).
....
The level of the LEI [ ] has an average eight to nine months lead time at peaks and troughs -- shorter at troughs ....As long as the weekly and monthly numbers come in strong, economists will be guided by mostly contemporaneous indicators released with a lag.
How come no one follows the leaders?
----
[Because generally for forecasters] Weak [coincident] numbers yield a weak outlook. Strong numbers mean good times ahead. Where's the forecasting?
In other words, we are bombarded by data telling us how the economy is right now or, more accurately, last month. Most economic forecasters, including most economic bloggers, by and large regurgitate this coincident data, and project the trend into the future. Thus strong coincident data is read to mean that the economy will continue to prosper. Weak coincident data is read to mean that the economy will continue to contract.
Trends do continue, but as a result most forecasters miss turning points.
For example, if you read economic blogs, in the last week or so you've probably seen a graph of the "Baltic Dry Shipping Index" like the one below demonstrating a collapse in shipping rates:
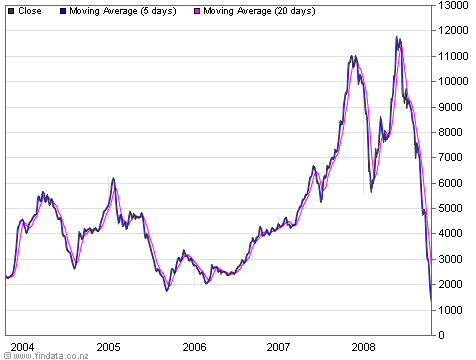
Most bloggers have cited it as proof that the economy will continue to tumble.
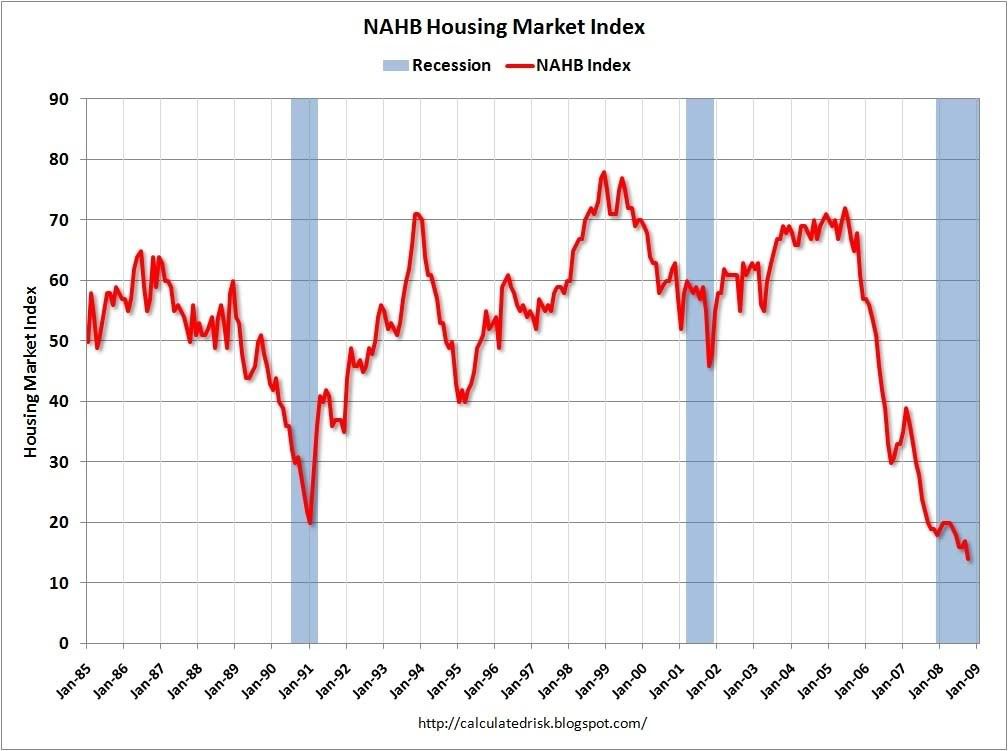
Similar collapses can be found in graphs of "Builders Confidence":
and housing starts:
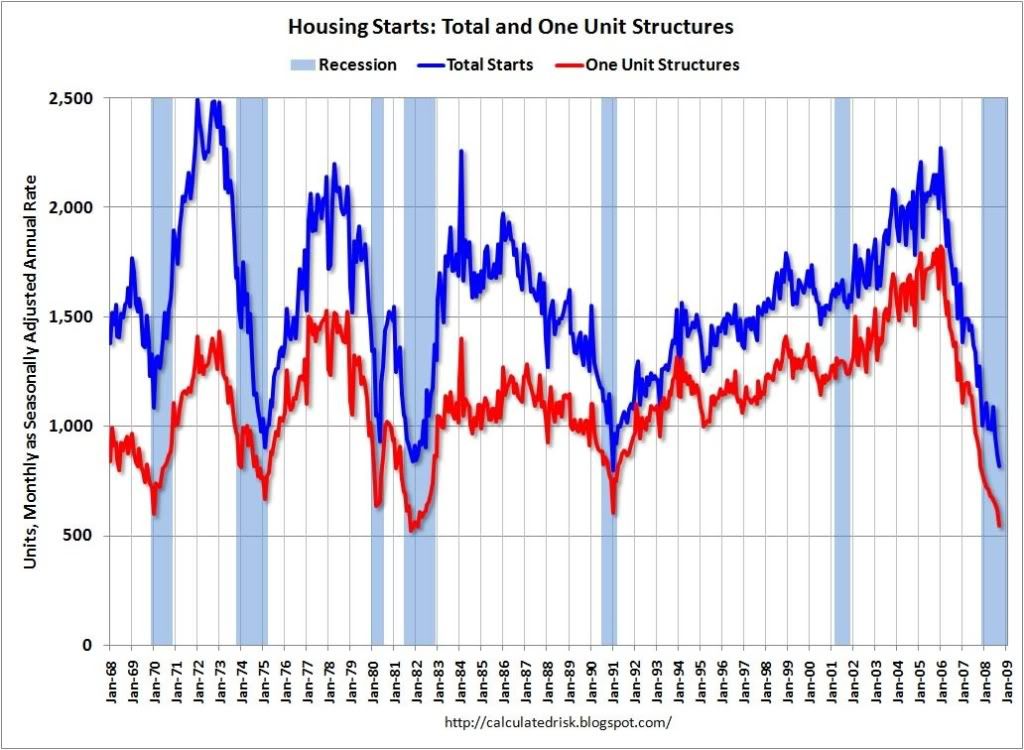
(h/t Calculated Risk)
and consumer confidence:
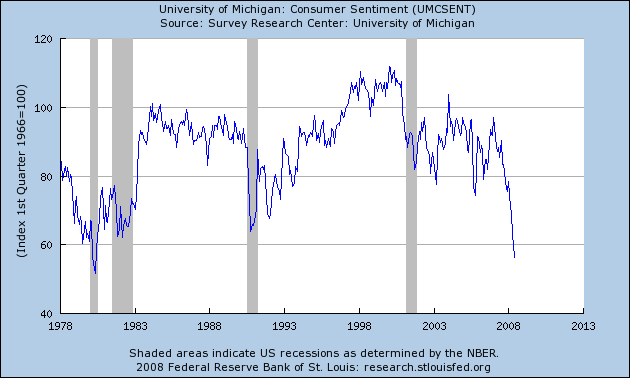
Typically these are all offered as support for the writer's thesis that the economy, going forward, is going to worsen.
But that's not what they say at all. What they really say is that the economy is very bad NOW as in September and October 2008. With the exception of housing starts, which is a valid leading indicator, they tell us nothing about 2009.
In fact, all of the above graphs show readings that in the past have coincided with the bottom of recessions! (Go back and take a look. I'll wait ....) So if anything they tell us that, more likely we are close to a bottom now than a top.
Even observers who are properly bullish or bearish let their natural dispositions and biases get in the way, and fail to account for contrary evidence.
For example, a couple of diaries ago I discussed the "Kasriel recession warning indicator" which accurately forecast in mid 2007 the recession this year. The simple fact is, not only does Kasriel's indicator accurately forecast recessions, but the data also gives excellent notice of recoveries as well. Bloggers who trumpeted Kasriel's indicator as proof of their proper bearishness last year, aren't interested in whether it might now signal strength in the future.
Returning to the Baltic Dry Index which has so abruptly collapsed, does this longer 15 year chart tell us that conditions will worsen, or that conditions have returned to normal?
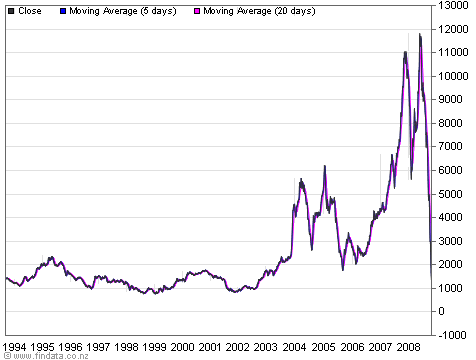
That's why, so often, you will read me going against the conventional wisdom of economic bloggers and pundits. I try to put my biases aside, look at countervailing data, and let the data itself speak, based on leading indicators, and the patterns of past recessions and recoveries.
So, what do the Leading Economic Indicators themselves say now?
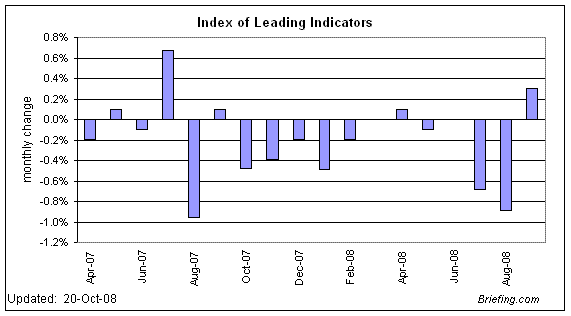
The LEI turned negative in summer of 2007. This recession probably began in about December. The indicators turned flat in spring (forecasting a respite?) then turned seriously negative in July and August, before a sharp rebound in September, due to the Fed's and Treasury's firehose of liquidity. If the liquidity firehose continues and the October and November LEI are also positive, that will indicate the Fed has succeeded and the recession may end by next spring. If the liquidity is not enough to overcome a deflationary asset and commodity spiral, then the recession will likely persist at least until next summer.

Comments
But you're Messin' with my Sky is Falling Motif!
Hey man, it's way more fun to try to imply Economic Armageddon, especially because we know the middle class is getting squeezed, almost regardless of a recovery.
All kidding aside, this is why you're a great read, the contraflow against the end of the world, really this time it is tide.
Its also
fun to be a contrarian no matter where that takes you. Just because the conventional wisdom has now embraced a big fall, doesn't mean its time to abandon it.
I'm not predicting armed revolution or mass starvation, but I think we're in for a recession bigger than the last few. And if it isn't, we're just punting the ball down the field.
PS: This site's captchas are tough.
Unpersuaded
That these bottoms coincide with other bottoms doesn't mean much to me. These are looking like extraordinary times.
If there is a paper rebound, it will be as phony as the last one and half as short. Too much job creation came from housing and housing-equity-financed consumption. Until you can explain to me the contours of a genuine rebound, I'm going to stay bearish.
"It's different this time" vs. simplifying
I am always wary of stories that rely upon "It's different this time."
In fact, there are some indicators that do accurately "predict" the 1929-33 and 1937-38 depressions. I've discussed two of them in my immediately previous blog posts.
That being said, if you simply based a forecast on the LEI themselves without elaboration, you'd perform better than the great majority of pundits:
Sometimes things are different
And what's to say the indicaters aren't just predicting a respite like they did in the spring?
Atlanta Fed: Forecasters miss turning points
Dave Altig of the Atlanta Fed is reading my blog, or my mind, or something. This morning he blogs that
The entire diary is well worth your reading, with detailed explanations and accompanying charts.