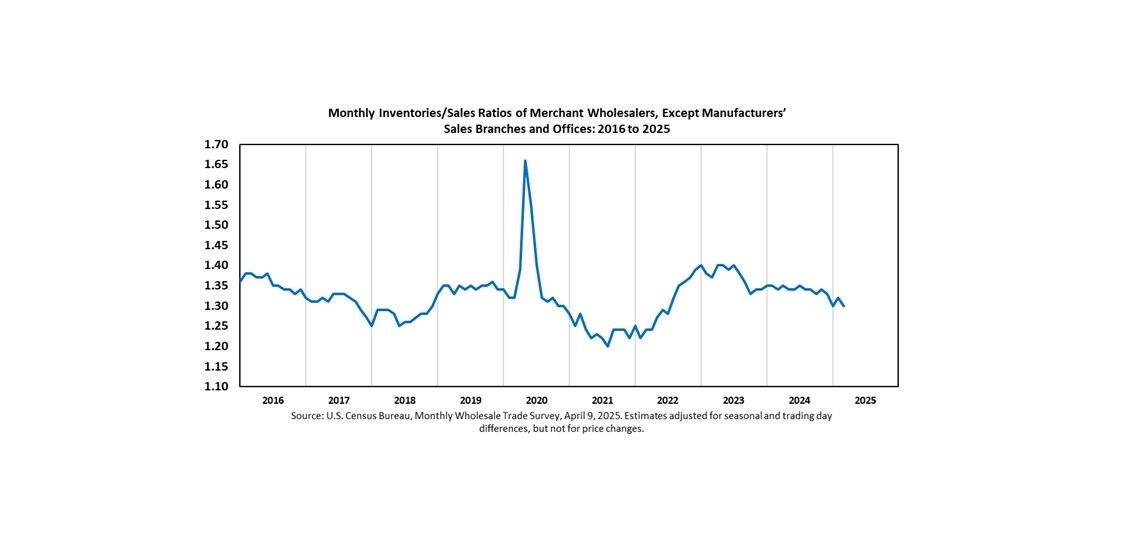
February 2010 Wholesale Trade Sales & Inventories was released today:
February 2010 sales of merchant wholesalers were $338.7 billion, up 0.8 percent (+/-0.7%) from last month. End-of-month inventories were $393.5 billion, up 0.6 percent (+/-0.5%) from last month.

Why should you care? Because with increased sales, if wholesalers see demand picking up, they restock, increase their inventories and that should mean some jobs.
In looking over the tables, for sales, durable goods is up 0.2% in sales while non-durable is up 1.4%. In non-durable, it's petroleum which is really up, 3.7%, (last month a 4.3% increase) and realize Wholesale inventories, sales are not adjusted for price (inflation). Durable sales was pulled down by hardware, -3.1% and "misc.", -4.0%.
On inventories, the increases which stick out are "durable misc.", 3.5%, then computers, 2.5% and again, petroleum, 3.1%. Chemicals inventories increased 2.9% and grocery inventories also increased 2.5%.
Some of the inventory build up has a correlation to a sudden reduced sales number. That doesn't sound like an exactly planned inventory build up by whole sales, more they got holding the bag on some inventory because they couldn't sell it as expected.
Some of these sectors generate more jobs than others, so while overall, with both sales and inventories increasing, it bodes well for more jobs, it is yet to be seen the ratio or the number of jobs might be implied.
If a reader knows of any correlation between these two metrics, please leave a comment or link in a comment. At this point I wanna see the proof of this continual implications mantra seen in the press.
The raw data, methodology details are here.
Subject Meta:
Forum Categories:
| Attachment | Size |
|---|---|
| 115.51 KB |

Recent comments