
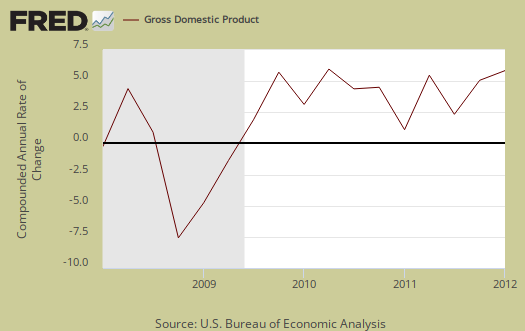
Q1 2012 real GDP showed 1.9% annualized growth., revised down from 2.2%. This article overviews and graphs the BEA statistical release for first quarter gross domestic product.
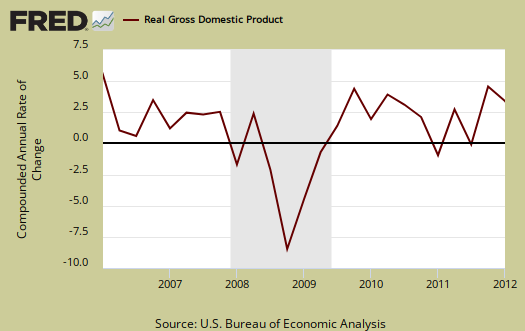
The revision to Q1 GDP showed less personal consumption, a much wider trade deficit component and even more cuts to government spending.
As a reminder, GDP is made up of: where Y=GDP, C=Consumption, I=Investment, G=Government Spending, (X-M)=Net Exports, X=Exports, M=Imports*.
The below table shows the revision changes between the advance Q1 GDP report and today's second estimate for Q1 2012 GDP. The table is by percentage points of components. The BEA rounds to one decimal place for GDP.
| Comparison of Q1 2012 GDP Component Revisions | |||
|---|---|---|---|
|
Component |
Advance |
2nd Revision |
Spread |
| GDP | +2.20 | +1.86 | -0.34 |
| C | +2.04 | +1.90 | -0.14 |
| I | +0.77 | +0.81 | +0.04 |
| G | –0.60 | –0.78 | -0.18 |
| X | +0.73 | +0.98 | +0.25 |
| M | –0.74 | –1.05 | -0.31 |
The below table shows the percentage point breakdown of the individual components contribution to overall GDP from Q4 2011 to Q1 2012. The difference, or spread, between Q4 and Q1 components is by percentage points.
| Comparison of Q4 2011 and Q1 2012 GDP Components | |||
|---|---|---|---|
|
Component |
Q4 2011 |
Q1 2012 |
Spread |
| GDP | +2.96 | +1.86 | -1.10 |
| C | +1.47 | +1.90 | +0.43 |
| I | +2.59 | +0.81 | -1.78 |
| G | –0.84 | –0.78 | +0.06 |
| X | +0.37 | +0.98 | +0.61 |
| M | –0.63 | –1.05 | -0.42 |
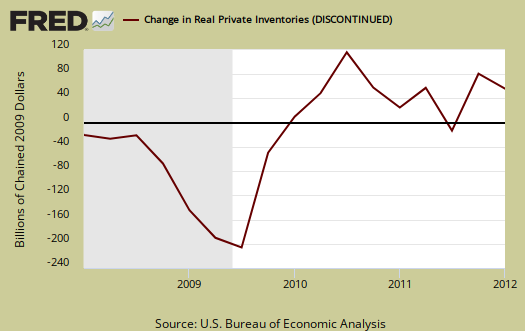
Changes in private inventories are part of I and was significantly revised, from 0.59 percentage points to a 0.21 percentage point contribution to overall GDP. This is a huge change from Q4 where changes in private inventories added 1.81 percentage points, or 61.2% of Q4 GDP growth. Q1 2012 saw changes in private inventories be 11.3% of overall real GDP growth. Companies increase inventories when they believe demand for their products will be picking up soon. Inventories can also build up when producers made more stuff they thought would sell.....but didn't, although in this case, producers will later be out to reduce that excess inventory. We can see the massive shedding of business inventories in 2009 in the below graph.
Government consumption and investments do add to U.S. economic growth in spite of the rhetoric one hears. The revision to government spending, from -0.60 percentage points to -0.78 percentage points means government spending reduced GDP growth by 29.6%. Of course GDP growth is anemic in other areas. Federal spending subtracted off –0.48 percentage points and state & local spending cuts resulted in a –0.30 percentage point contribution, revised down from –0.14 percentage points. Federal national defense spending was the biggest drop, with a –0.46 percentage point GDP contribution. Below is the percentage quarterly change of government spending, adjusted for prices, annualized.

Below the FRED graph for C, or real personal consumption expenditures contribution to GDP. As we can see from the above component breakdowns, PCE, or C in the above GDP equation and tables, was revised down yet did contribute almost half a percentage point to Q1 2012 GDP and increased from the 4th quarter.

Below is the breakdown in C or real PCE annualized change. The Q1 PCE 1.9 percentage point breakdown was a +0.47 percentage point contribution in services, revised down from +0.57, with most of that being household consumption or 0.36. Housing and utilities subtracted off -0.30 percentage points, financial products added +0.25 percentage points and food services, hotels added +0.23 points, in the breakdown of services.
Within PCE (C), goods added +1.44 percentage points with durable goods contributing +1.05 percentage points to GDP. Notice when times are tough, durable goods (bright red in the below graph) consumption drops. Gasoline and other energy goods was –0.06 percentage points of Q1 GDP. These percent point contributions are real or adjusted for inflation using CPI. In real dollars, or having price increases removed, the BEA is claiming gasoline and energy goods (not household utilities), were consumed less in Q1. What this strange percentage point decline tells us is people used less gasoline and no surprise since prices have gone through the roof. PCE is often revised from the advance report as receipts and reports are collected. Below is PCE with the quarterly annualized percentage change breakdown of goods versus services (maroon).

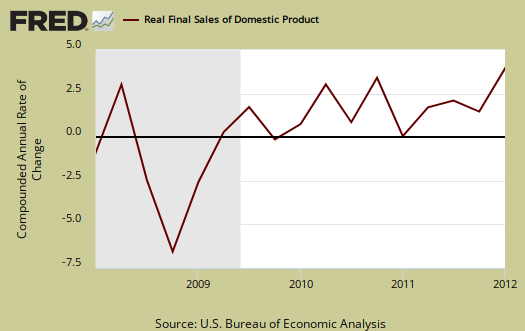
Below are real final sales of domestic product, or GDP - inventories change. This gives a better feel for real demand in the economy. This is because while private inventories represent economic activity, the stuff is sitting on the shelf, it's not demanded or sold. Q1 Real final sales increased 1.7% for Q1 and in Q4 real final sales were just 1.1%.
Below are net exports, or the trade deficit, in real chained dollars, by quarter and up to Q1 2012. Imports subtract from gross domestic product.
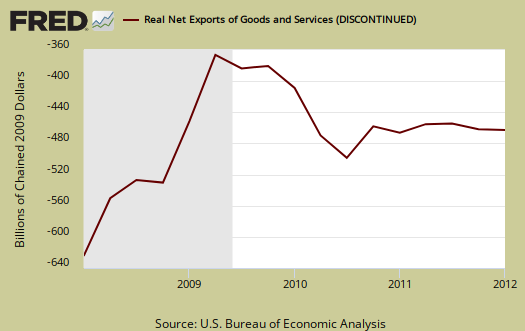
The below graph shows real imports vs. exports. Both imports and exports were significantly revised as we mentioned they would be in the advance report overview. As expected we went from a -0.01 trade deficit component of GDP in the advance to a trade deficit of -0.07 percentage points for Q1 2012. Still exports surging is welcome news. The trade deficit component of Q4 2011 GDP was -0.26 percentage points.

Gross domestic purchases are what U.S. consumers bought no matter whether it was made in Ohio or China. It's defined as GDP plus imports and minus exports or using our above equation: where P = Real gross domestic purchases. Real gross domestic purchases was revised down, from 2.1% to a 1.9% increase for Q1, whereas Q4 had a 3.1% increase. Exports are subtracted off because they are outta here, you can't buy 'em, but imports, as well a know all too well, are available for purchase at your local Walmart. When gross domestic purchases exceed GDP, that's actually bad news, it means America is buyin' imports instead of goods made domestically. As we can see, GDP and gross domestic purchases are equal and just a slight improvement from Q4 to Q1.
Below are the percentage changes of Q1 2012 GDP components, from Q4. Realize there is a difference between percentage change and percentage point change. Point change adds up to the total GDP percentage change and is reported above. The below is the individual quarterly percentage change, against themselves, of each component which makes up overall GDP. Additionally these changes are seasonally adjusted and reported by the BEA in annualized format.
| Comparison of Q1 2012 Component Percentage Change Between Revisions | |||
|---|---|---|---|
|
Component |
Advance |
2nd Revision |
Spread |
| GDP | +2.2% | +1.9% | -0.3% |
| C | +2.9% | +2.7% | -0.2% |
| I | +6.0% | +6.3% | +0.3% |
| G | –3.0% | –3.9% | -0.9% |
| X | +4.3% | +7.2% | +2.9% |
| M | +5.4% | +6.1% | +0.7% |
The BEA's comparisons in percentage change breakdown of 2nd quarter GDP components are below. Changes to private inventories is a component of I.
C: Real personal consumption expenditures increased 2.7 percent in the first quarter, compared with an increase of 2.1 percent in the fourth. Durable goods increased 14.3 percent, compared with an increase of 16.1 percent. Nondurable goods increased 2.3 percent, compared with an increase of 0.8 percent. Services increased 1.0 percent, compared with an increase of 0.4 percent.
I: Real nonresidential fixed investment increased 1.9 percent in the first quarter, compared with an increase of 5.2 percent in the fourth. Nonresidential structures decreased 3.3 percent, compared with a decrease of 0.9 percent. Equipment and software increased 3.9 percent, compared with an increase of
7.5 percent. Real residential fixed investment increased 19.4 percent, compared with an increase of 11.6 percent.X & M: Real exports of goods and services increased 7.2 percent in the first quarter, compared with an increase of 2.7 percent in the fourth. Real imports of goods and services increased 6.1 percent, compared with an increase of 3.7 percent.
G: Real federal government consumption expenditures and gross investment decreased 5.9 percent in the first quarter, compared with a decrease of 6.9 percent in the fourth. National defense decreased 8.3 percent, compared with a decrease of 12.1 percent. Nondefense decreased 0.8 percent, in contrast to an increase of 4.5 percent. Real state and local government consumption expenditures and gross investment decreased 2.5 percent, compared with a decrease of 2.2 percent.
Motor Vehicles GDP contribution was an astounding 1.12 percentage points. Compare that to computer final sales, which was revised down to 0.03 from 0.05 percentage points of Q1's 1.9% GDP. Motor vehicles are different from personal consumption, or C sub-component auto & parts, this is an overall separate index. Motor vehicles, computers are bought as investment, as fleets, in bulk, by the government and so forth.
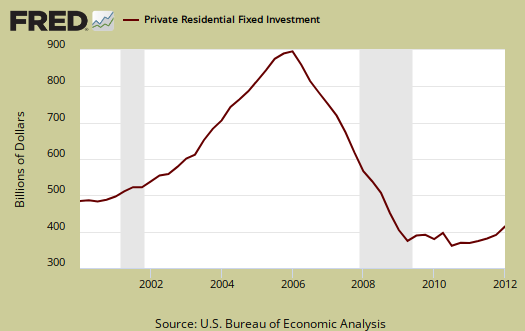
Residential fixed investment was revised up from 0.04 to 0.41 of Q1 GDP by percentage points. Below is the raw totals on residential investment. If one could ever see the housing bubble and then it's collapse in terms of economic contributions, the below graph is it, although Q4's residential fixed investment GDP percentage point contribution was 0.25.
Private, or not from the government, fixed investment was significantly revised, from 0.18 to 0.61 percentage points of Q1 GDP. Nonresidential fixed investment was revised, from –0.22 to +0.20 percentage points with structures, a sub-component of nonresidential fixed investment, revised from a –0.35 percentage point contribution to a -0.09 GDP contribution by percentage points. Structures are commercial real estate.

The price index for gross domestic purchases, was 2.4% for Q1 and not revised. Q4's gross domestic purchases price index was 1.1%. This index measures price increases in the U.S. In other words, there was way more inflation than last quarter. Core price index, or prices excluding food and energy products, was revised, from 2.2% to 2.3% for Q1.
Here's something even more not so hot, GNP:
Real gross national product -- the goods and services produced by the labor and property supplied by U.S. residents -- increased 1.3 percent in the first quarter, compared with an increase of 1.8 percent in the fourth. GNP includes, and GDP excludes, net receipts of income from the rest of the world, which decreased $16.4 billion in the first quarter after de creasing $36.7 billion in the fourth; in the first quarter, receipts decreased $4.2 billion, and payments increased $12.1 billion.
In current dollars, not adjusted for prices, GDP, or the U.S. output, is $15.454 trillion, revised from a 3.8% to a 3.6% increase from Q4. Applying the price indexes, or chained, real 2005 dollars, Q1 2012 GDP was $13.491 trillion. Both numbers are annualized.
Here is the overview for the Q1 2012 GDP, advance report, text unrevised, graphs are updated.
* In Table 2, the BEA reports GDP contribution components with their equation sign. If durable goods for example, decreased over the quarter or year, it is reported as a negative number. Imports, from the GDP equation, are already a negative for that is not something produced domestically. A negative sign implies imports increased for the time period and a + sign means the change in imports decreased. Or, from the GDP equation: . Confusing but bottom line exports add to economic growth, imports subtract.
Recent comments