
December 2016 retail sales increased by 0.6% and are up a whopping 4.1% from a year ago. November's retail sales were revised to a 0.2% monthly increase. The reason for December's gain were automobile sales, online sales and gas. Auto sales blew through the roof at a 2.4% monthly increase and gas did also on rising prices. Without autos & parts sales, retail sales would have increased only 0.2% for the month. Retail sales without gasoline station sales considered would have been a 0.5% monthly increase. For the year, retail sales without auto sales have increased 3.4%. Nonstore (online) retailers have shot up by 13.2%. Overall retail sales are a good sign for consumer spending growth and also for the increasing online shopping use.
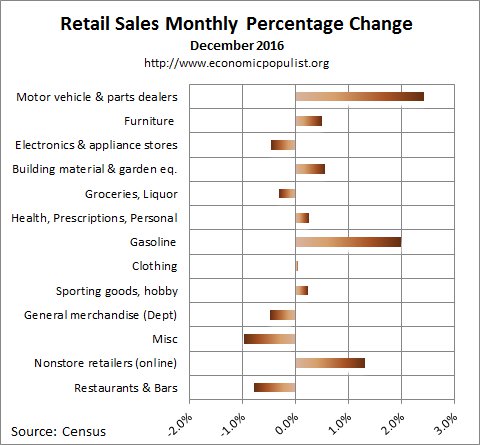
Graphed are the retail sales categories monthly percentage changes. General Merchandise includes Walmart, super centers, Costco and so on. Department stores by themselves declined by -0.6% for the month which is awful for the holidays. From a year ago, department store sales have declined by -8,4%, a terrible figure and explains the flurry of closings and layoffs going on. Grocery stores by themselves had no change for the month and have increased by 2.4% for the year. Miscellaneous retailers declined by -1.0% for the month but have increased 7.1% for the year. Sporting goods, hobby, book and music stores are down -3.6% for the year and electronic & appliance store sales have dropped by -2.4% for the year. Health and personal care had a 0.2% increase for the month but has soared up by 6.2% for the year. Online shopping continues to increase with a whopping 1.3% monthly gain and an annual one of 13.2%. One has to wonder if the increase in online shopping story is correlated with less demand in gasoline. These figures are seasonally adjusted.
Below is a graph of just auto sales. For the year, motor vehicle sales have increased just 7.2%. Autos & parts together increased 2.4% for the month and 6.8% from a year ago.

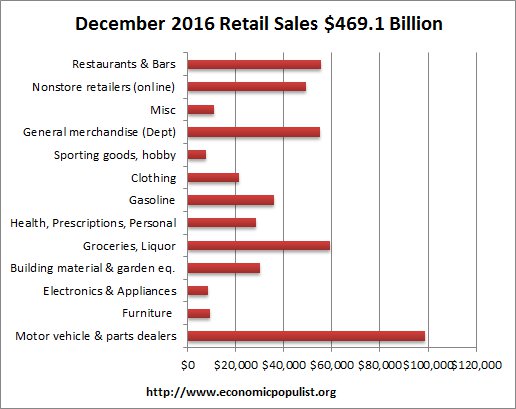
Total December retail sales were $469.1 billion. Below are the retail sales categories by dollar amounts. As we can see, autos are by far the largest amount of retail sales even groceries behind. By volume, auto dealers by themselves were $91.3 billion of sales. Grocery stores by themselves are $52.9 billion. Compare that to retailers without brick and mortar stores, which were $49 billion and gas at $35.9 billion. It is astounding how autos dominate retail sales, even above groceries on a monthly basis.
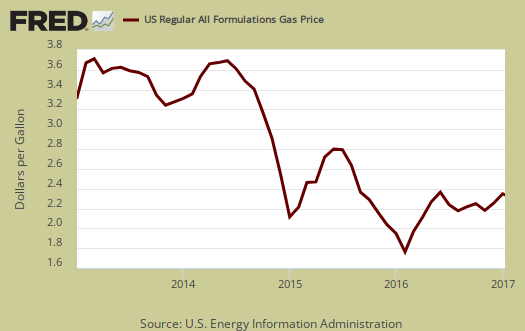
Graphed below are weekly regular gasoline prices, which is strongly correlated to retail sales figures. We can see how prices have decreased again of recent.
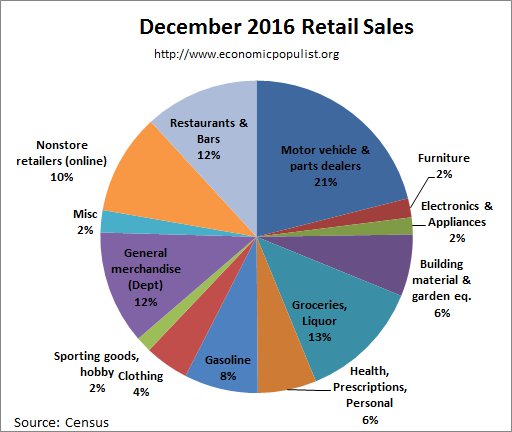
The below pie chart breaks down the monthly seasonally adjusted retail sales by category as a percentage of total sales by dollar amounts. What is amazing is how auto sales & parts dominate even above restaurants, bars, groceries and booze combined it barely exceeds autos & parts. Another thing to notice is how online sales are coming up on general merchandise sales overall. I don't know about you, but I need to try on clothes and at this point I'm worried that's going to consist of putting things in a box with a return label.
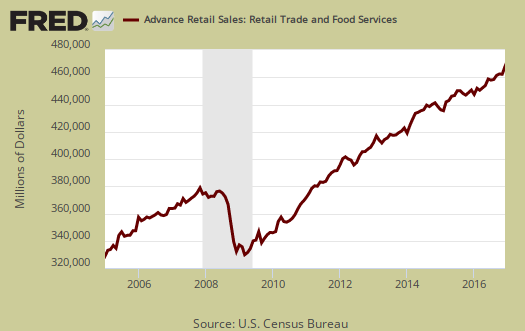
Retail sales correlates to personal consumption, which in turn is about 70% of GDP growth. Yet GDP has inflation removed from it's numbers. This is why Wall Street jumps on these retail sales figures. That said, retail sales is just a small part of personal consumption expenditures. The last month, November of real retail sales was 192.4 billion. Below is the graph of retail sales in real dollars, or adjusted for inflation.

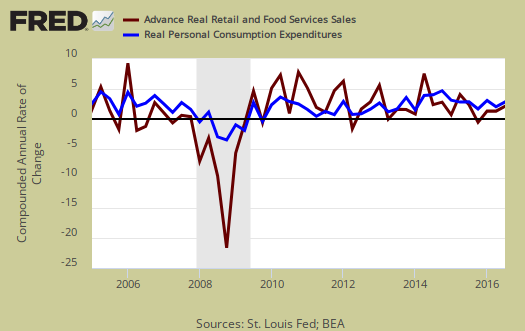
While in no way do retail sales equal consumer spending in the United States, there is a strong correlation of trend. Below is a graph of real PCE against real retail sales, quarterly, up to Q3 2016. See how closely the two track each other? PCE almost looks like a low pass filter, an averaging, removal of "spikes", of real retail sales.
Retail sales are not adjusted for price increases, not reported in real dollars. Real economic growth adjusts for inflation. Retail sales has variance, margins of error, and is often revised as more raw data comes into the U.S. Department of Commerce (Census division). For example, this report has an error margin of ±0.5% and annually has an error margin of ±0.9%. Data is reported via surveys, and is net revenues of retail stores, outlets. Online retail net revenues are asked in a separate survey of large retail companies (big box marts). This is also the advanced report. To keep the monthly nominal percentage changes in perspective, below is the graph of monthly percentage changes of retail sales since 2013.

For the three month moving average, from October to December in comparison to the July to September average, retail sales have increased by 1.6%. The retail sales three month moving average in comparison to a year ago is also 4.1%. Overall as shown the below graph of quarterly annualized retail sales percentage change, up to Q4 2016.

Overall retail sales point to solid consumer spending and in particular a great month for auto sales. Prices can be part of this as retail sales are not adjusted for inflation. We know gasoline sales' increase is partly due to increased prices. Contrary to what the press implies, the world does not yet revolve around Amazon quite yet, although Jeff Bezos is certainly on the road to make that happen. As always, advance reports almost always are revised the next month as more raw sales data is collected by the Census and many other elements to the economy go into GDP, retail sales is not the end all, be all metric.
Here are past retail sales overviews, not revised.
Recent comments