
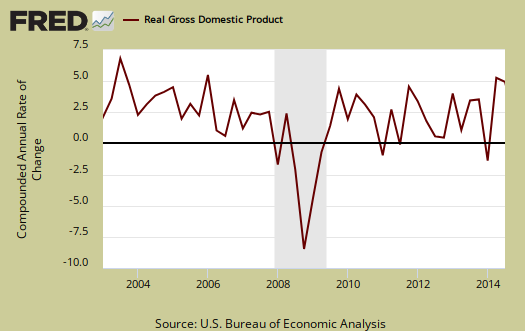
Third quarter 2014 real GDP was revised up even further to a whopping 5.0%. Merry Christmas Wall Street as the Dow closed above 18,000, a record high. This is the highest quarterly GDP since Q3 2003, a full eleven years ago. The reason for the revision blow out was consumer spending and investment. Real consumer spending was revised up almost 3/4th of a percentage point more than the first revision previously reported. Overall, Q3 GDP has been revised a full 1.5 percentage points upward from the original, advance report. Overall Q3 GDP was a surprisingly holiday surprise.
As a reminder, GDP is made up of: where Y=GDP, C=Consumption, I=Investment, G=Government Spending, (X-M)=Net Exports, X=Exports, M=Imports*. GDP in this overview, unless explicitly stated otherwise, refers to real GDP. Real GDP is in chained 2009 dollars.
This below table breaks down the revisions from the advance report and now in Q3 GDP. We expected imports to be revised dramatically up but the changes to private inventories was a bonus boost to Q3 growth which negated increased imports.
| Comparison of Q3 Advance 2014 and Q3 Revision 2014 GDP Components | |||
|---|---|---|---|
|
Component |
Q3 2014 Now |
Q3 2014 Previous Revision |
Spread |
| GDP | +4.96 | +3.89 | +1.07 |
| C | +2.21 | +1.51 | +0.70 |
| I | +1.18 | +0.85 | +0.33 |
| G | +0.80 | +0.76 | +0.04 |
| X | +0.61 | +0.65 | -0.04 |
| M | +0.16 | +0.12 | +0.04 |
We now have two very strong quarters of great GDP growth. This below table shows the percentage point spread breakdown of Q2 from Q3 2014 GDP major components and their spread.
| Comparison of Q3 2014 and Q2 2014 GDP Components | |||
|---|---|---|---|
|
Component |
Q3 2014 |
Q2 2014 |
Spread |
| GDP | +4.96 | +4.59 | +0.37 |
| C | + 2.21 | +1.75 | +0.46 |
| I | +1.18 | +2.87 | -1.69 |
| G | +0.80 | +0.31 | +0.49 |
| X | +0.61 | +1.43 | -0.82 |
| M | +0.16 | –1.77 | +1.93 |
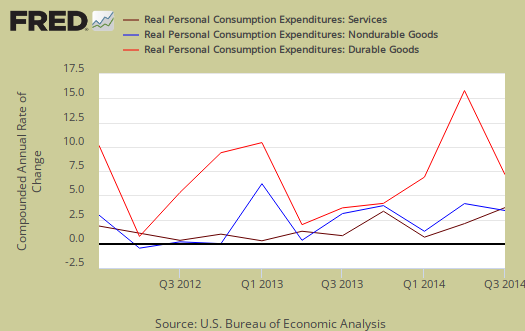
Consumer spending, C was now 44.6% of GDP, revised upward from 39%. Durable goods were now a 0.67 percentage point GDP contribution, slightly revised upward. Motor vehicles & parts consumer spending added 0.28 percentage points to GDP. In consumer spending services, food & accommodation services was 0.21 percentage points while financial & insurance was 0.35 percentage points, which makes one wonder how jacked consumers are getting on finance charges. Housing and utilities was a -0.22 GDP percentage point contribution which reflects the decreasing energy demand. Below is a percentage change graph in real consumer spending going back to 2000.

Graphed below is PCE with the quarterly annualized percentage change breakdown of durable goods (red or bright red), nondurable goods (blue) versus services (maroon).
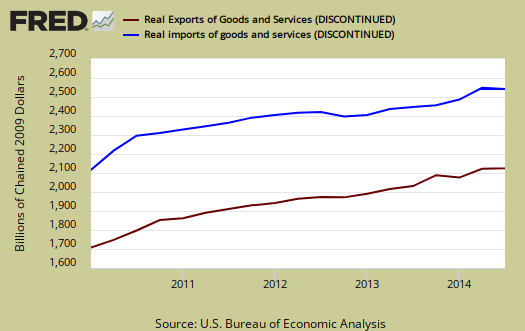
Imports and Exports, M & X added 0.78 percentage points to Q3 GDP. Exports were 0.61 percentage points as imports were 0.16 percentage points. This indicates imports were way way less in Q3 than Q2 GDP's -1.77 percentage point contribution.
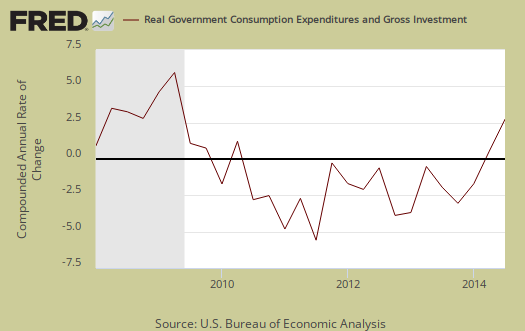
Government spending, G contributed 0.80 percentage points to Q3 GDP, where once again, most of the growth was in national defense spending. National defense spending added 0 .66 percentage points to GDP,whereas state and local government spending added 0.13 percentage points to real GDP.
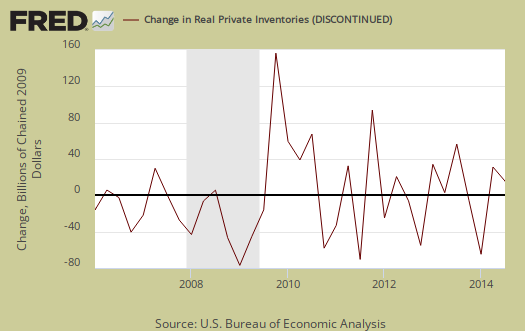
Investment, I is made up of fixed investment and changes to private inventories. Investment contributed 1.18 percentage points to Q3 GDP. The change in private inventories alone was revised upward again to now a -0.03 percentage point contribution. Originally changes to private inventories was estimated to be -0.57 percentage points of GDP. Below are the change in real private inventories and the next graph is the change in that value from the previous quarter.

Fixed investment is residential and nonresidential and was revised upward to 1.21 percentage points from 0 .97 percentage points. This is a total revision of 0.36 percentage points from the original Q3 GDP estimate. Nonresidential was really revised upward, from 0.88 percentage points of GDP to 1.10 percentage points, with equipment being revised up to 0.63 percentage points. Nonresidential structures by themselves was revised upward to 0.14 percentage points, a 0.12 percentage point increase from the previous revision.

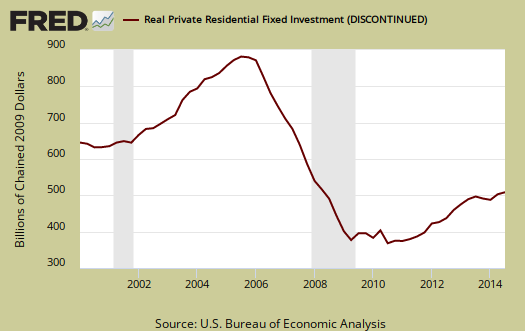
Residential fixed investment added only 0.10 percentage points to Q3 GDP. The below graph of residential fixed investment really shows the housing bubble and the lack of economic growth contribution of residential fixed investment to this day.
Nominal GDP: In current dollars, not adjusted for prices, of the U.S. output,was $17,599.8 billion, a 6.4% annualized increase from Q2. In Q2, current dollar GDP increased 6.8%. This shows how inflation and international prices impact real GDP from the wider variance when not adjusted.

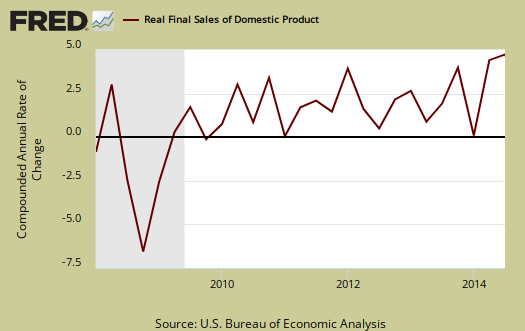
Real final sales of domestic product is GDP - inventories change. This figures gives a feel for real demand in the economy and is the best news in this report. This is because while private inventories represent economic activity, the stuff is sitting on the shelf, it's not demanded or sold. Real final sales increased 5.0%. Q2 real final sales were 3.2%, so in terms of real economic activity, Q3 is now officially a blow out.
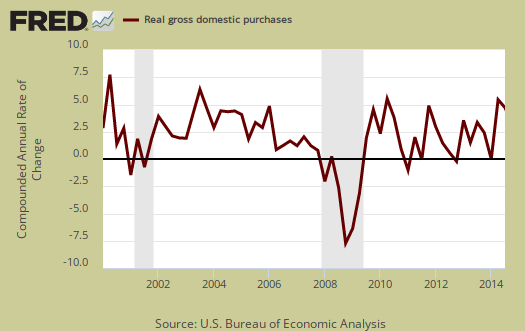
Gross domestic purchases are what U.S. consumers bought no matter whether it was made in Ohio or China. It's defined as GDP plus imports and minus exports or using our above equation: where P = Real gross domestic purchases. Real gross domestic purchases increased 4.1%. Q2 was 4.8%. Exports are subtracted off because they are not available for purchase by Americans, but imports, as well a know all too well, are available for purchase in the U.S. When gross domestic purchases exceed GDP, that's actually bad news, it means America is buying imports instead of goods made domestically.
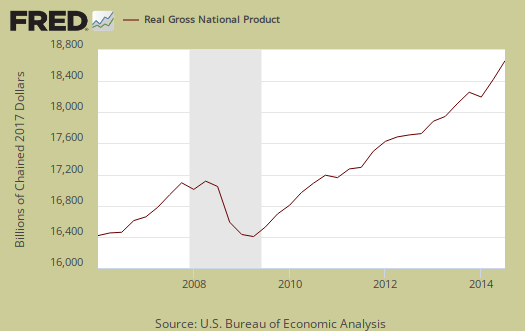
GNP - Gross National Product: Real gross national product, GNP, is the goods and services produced by the labor and property supplied by U.S. residents.
GNP = GDP + (Income receipts from the rest of the world) - (Income payments to the rest of the world)
Real GNP increased 5.3% for Q3. In Q2 GNP increased 4.6%. GNP includes, whereas GDP excludes, net income from the rest of the world. GNP increases beyond GDP if Americans made out like bandits from foreign investments more than foreigners cashed in on investments within the U.S. borders.
GDI - Gross Domestic Income: Gross Domestic Income is all income from within the borders of a nation and should normally equal GDP. GDI is wages, profits & taxes minus subsidies. Real GDI was 4.7% in Q3. Q2 GDI was a 4.0% increase. The BEA says GDI measures the economic output as the costs incurred as well as incomes earned in the production of GDP. The BEA also states GDI can have statistical discrepancy over short time periods.

Below are the revised percentage changes of Q3 2014 GDP components, from Q2. There is a difference between percentage change and percentage point change. Point change adds up to the total GDP percentage change and is reported above. The below is the individual quarterly percentage change, against themselves, of each component which makes up overall GDP. Additionally these changes are seasonally adjusted and reported by the BEA in annualized format. National Defense spending alone increased 16% in Q3, investment in equipment increased 11% and the very questionable increase in intellectual property products was 8.8%.
|
Q3 2014 GDP Component Percentage Change (annualized) |
|||
|---|---|---|---|
| Component | Percentage Change from Q2 | ||
| GDP | +5.0% | ||
| C | + 3.2% | ||
| I | + 7.2% | ||
| G | + 4.4% | ||
| X | +4.5% | ||
| M | –0.9% | ||
Other overviews on gross domestic product can be found here. The BEA GDP site is here.
widespread misreporting on this release..
both the Wall Street Journal and Zero Hedge headlined health care spending as the reason for the jump in GDP, and by the time that reporting was digested by Ilargi at Automatic Earth and Yves at Naked Capitalism it became "health-care spending makes up 2/3 of the 5%"
as i've been trying to point out whereever it's been misreported, real health care outlays were just a tenth of the 3rd quarter GDP increase and less than half of the upward revision….they actually increased at a real rate of 4.6%, so health care outlays were actually a small drag on the overall quarterly increase…
here's my breakdown of PCE, with the links showing my math:
real personal consumption expenditures, the largest component of GDP, were revised to show growth at a 3.2% annual rate rather than the 2.2% growth rate reported last month, and hence they contributed 2.21% to the quarter's growth rate, not the 1.51% previously estimated...real consumption of durable goods grew at a 9.2% rate, revised from the 8.7% growth rate reported in the second estimate, and added .67% to the final GDP figure; major contributors to that were a 15.7% real growth rate in consumption of recreational goods and vehicles and a 11.2% real growth rate in motor vehicle and parts consumption, while real consumption of furnishings and durable household equipment rose slightly and consumption of other durable goods fell, even as all durables consumption benefited from a negative 2.1% deflator...meanwhile, real personal consumption of non-durable goods rose at a 2.5% rate and added 0.39% to GDP, revised from the previous estimate of a 2.2% growth rate, even though inflation adjusted outlays for food and beverages, clothing, and energy goods were virtually unchanged....in addition, real consumption of services grew at an 2.5% rate and added 1.15% to the quarter's growth, revised from the 1.2% growth rate and 0.53% addition reported in the second estimate last month, as real consumption of financial services and insurance grew at a 7.0% annual rate, real consumption of food and lodging services grew at a 4.9% rate, and real outlays for health care services rose at a 4.6% rate, offsetting a small decrease in real outlays for housing and utilities and while outlays for recreation and other services were flat..
rjs
big conception error goingon on GDP
percentage point contribution is more fractional whereas percentage are against themselves. In other words, defense spending increased 16% from Q2, yet contributed 0.66 to GDP, that's roughly 13.3%.
Health care spending is right under services and it was 0.52 percentage point contribution, or 10.5% of Q3 GDP.
They (and you I think) are mixing percentage point contributions against percentages. The percentages are against themselves and the percentage point contribution breakdown, if you add them all up and then attribute for rounding, error ...that adds up to GDP 4.96%.
Not the first time ZH has done this.
i got it..
i just may not spit it out right...i report from the tables here: http://www.bea.gov/newsreleases/national/gdp/2014/pdf/gdp3q14_3rd.pdf
the percentage increases of each are shown in table 1, and the itemized percentage contributions to the GDP change are shown in table 2...then the current dollar and inflation adjusted changes are shown in table 3...when i compute the annualized change for figures such as health care that are not itemized in table 1, i take the quarterly 2009 chained dollar change in table 3 to the 4th power to give an annualized figure that would be comparable to the annualized GDP figures quoted elsewhere in the report..
rjs
that's right
Just to confirm, you're right, it's 4.6% annualized increase and I just have no idea where they came up with such a wild hair unless there is some other specialized index, sure not from consumer spending.
deliberate obfuscation from Zero Hedge
the Wall Street Journal was just misleading, as if they wrote half the story & headline beforehand because they knew that health care outlays would be revised up...but Zero Hedge deliberately punked their readers, posting a chart showing just the revisions to PCE between the 2nd estimate and this one, such that 3rd quarter GDP appeared to be all about health care, which was the way they wrote about it...others spread that story from there...
rjs
Santa's Real Workshop
In a town in China that makes the world's Christmas decorations, there’s no snow and no elves, just 600 factories that produce 60% of all the decorations in the world.
http://www.theguardian.com/artanddesign/architecture-design-blog/2014/de...