The DOL reported people filing for initial unemployment insurance benefits in the week ending on April 13th, 2013 was 352,000, a 4,000 increase from the previous week of 348,000. This is the wrong direction for weekly initial unemployment claims and indicates slow hiring once again.

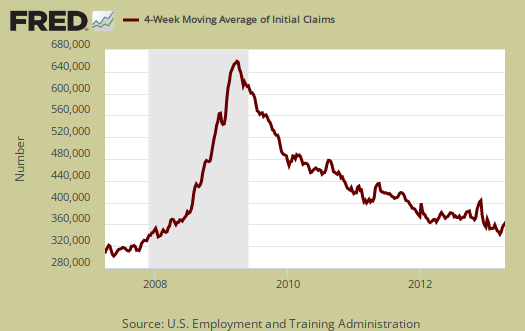
The statistic to pay attention to is the four week moving average on initial unemployment claims. The four week moving average increased 2,750 to 361,250, and back to February 2013 levels after March's drop gave false hope the job market was improving. In the below graph we can the four week moving average is still at recession levels and seemingly staying there, now over five years. If anyone recalls, even before the Great Recession the job market was not so hot. The four week moving average, graphed below is set to a log scale, from April 1st, 2007.

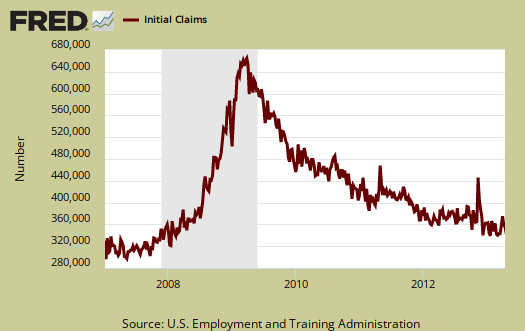
Below is the mathematical log of initial weekly unemployment claims. A log helps remove some statistical noise, it's kind of an averaging and gives a better sense of a pattern. As we can see, we have a step rise during the height of the recession, but then a leveling, then a very slow decline, or fat tail. That fat tail has taken over five years to return to early recession levels, but initial claims are still not at pre-recession figures. Now initial claims are increasing again to boot.

As much as people wish it so, most government data is not complete and not real time. We have repeatedly warned, ad nauseum, do not bank on the initial claims number reported in the press release for that week. Initial claims for unemployment benefits is a weekly statistic and that implies a very short time window for data collection, it is always revised the next week, almost always upward. One can have unusual events which throw off the seasonal adjustment algorithm. One can have missed timing of events that can also throw a monkey wrench in one week's worth of data. As we pointed out in our weirdness in initial unemployment claims article, states might not report their quarterly adjustments for emergency unemployment benefits and we had the infamous fiscal cliff push past the final hour, which included extending those unemployment benefits for the long term unemployed.
Continuing unemployment claims for the previous week decreased, yet we still have large long term unemployed. The below continuing claims figure doesn't include those receiving extended and emergency unemployment benefits.
The advance number for seasonally adjusted insured unemployment during the week ending April 6 was 3,068,000, a decrease of 35,000 from the preceding week's revised level of 3,103,000. The 4-week moving average was 3,083,000, a decrease of 2,250 from the preceding week's revised average of 3,085,250.
In the week ending March 30th, not seasonally adjusted, the official number of people obtaining some sort of unemployment insurance benefit was 5,152,655 with 1,782,555 people receiving EUC, which was extended to January 2014 in the 11th fiscal cliff hour. There were 12 million official unemployed in March. .
It doesn't appear initial claims is very slowly returning to normal levels. The job market is still so poor, we see nothing on the horizon to show initial unemployment claisms will return to 2007 levels soon. The initial claims moving average increase is worst than it looks, simply because this has going on past half a decade with no end in sight. Seeing a rise again in the moving average implies American workers are being jerked around like a yo-yo on a string.

Reuters had a ridiculous headline on claims spinning it
1) Reuters earlier had a headline that said "Jobless data calms concerns on labor market" and basically said even though claims increased from last week, the increase wasn't as bad as it could have been, thus, things were good according to the article. Yup, things are bad, but since we're not all dead or in a nuclear war, hey, don't complain. Reuters didn't mention the labor participation rate or U-6 for obvious reasons.
2) Saw a study that said people that were between jobs or unemployed for any period of time would not get hired for jobs, but people in jobs but that had no relevant experience for another job would get hired for that job over a qualified unemployed person. Now how's that for American innovation!
People are only hired for jobs if they have a job, and people with skills or a desire to learn new things and help the USA are permanently locked out of their own country. Took some time off to learn new skills, took care of a dying relative, had cancer, or went back to school? Did your embezzling boss fire you because you wouldn't go along with theft or did he fire you because you caught him harassing employees? Did your factory close down due to the economy? Too bad, doomed to be homeless at any age. One doesn't need a jobs commission or laser-like focus or 5,000,000,0000 more visa openings to figure out what's wrong with this country and where it's headed.
it's the level average
It is by levels as initial claims has a side indicator of labor flows. You can only get UI if you're out of a job by no choice, i.e. layoff, firing.
Also, we have a larger population, even though the labor force has shrunk, we think that is because people have dropped out of the labor force due to no jobs to be had.
Bottom line 400k initial claims means very bad things are happening, as in jobs slaughter, 375k initial claims means layoffs are really still happening and there isn't much hiring.
350k initial claims means layoffs are not happening but there is little hiring. 325k initial claims means little layoffs and there is hiring going on.
Every week we see thousands of financial press headlines that are very often completely wrong, decoupled from the statistics or what it means and initial claims has to be the worse of the lot for this practice.
Traders go off of initial claims and why the ridiculous, misleading headline buzz.
With TBTF and QE, every headline is "good news" to banksters
Every headline is fodder for pumping the stock market (means nothing to Main Street, only TBTF playing with QE money). Bad economic news (e.g., unemployment, Euro Ponzi, etc.) = more QE and Fed intervention, thus, more free $ for banksters to inflate commodities and stocks with. And on the other hand, good news in jobs or other areas = good news to pump the stock market with. They can never lose.
except for Gold
Gold just crashed and burned but it really is unclear why and many are pointing to more market rigging to see a crash like that so fast. Gold is a commodity, but without that much utility.
initial claims April 20th, 339k
I don't like to overview initial claims ever week, but this week initial claims was 339k, an 16k drop.
That said, last week was revised up by 3,000, so it's a wait and see. We don't see anything economically speaking that would get initial claims down to 2007 levels happening and it would not surprise me to see this week's figure revised upward next week.
i.e. we think initial claims is still stuck in mud.