The key reports scheduled for this week are the advance estimate of Q1 GDP, March New Home sales and March Personal Income and Outlays.
For manufacturing, the April Richmond and Kansas City manufacturing surveys will be released.
----- Monday, April 22nd -----
8:30 AM ET:
Chicago Fed National Activity Index for March. This is a composite index of other data.
----- Tuesday, April 23rd -----
10:00 AM:
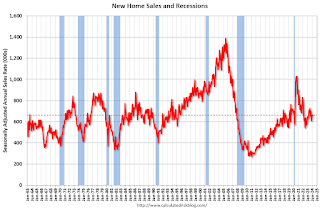
New Home Sales for March from the Census Bureau.
This graph shows New Home Sales since 1963. The dashed line is the sales rate for last month.
The consensus is for 670 thousand SAAR, up from 662 thousand in February.
10:00 AM:
Richmond Fed Survey of Manufacturing Activity for April.
----- Wednesday, April 24th -----
7:00 AM ET: The Mortgage Bankers Association (MBA) will release the results for the
mortgage purchase applications index.
8:30 AM:
Durable Goods Orders for March from the Census Bureau. The consensus is for a 2.0% increase in durable goods orders.
During the day: The AIA's
Architecture Billings Index for March (a leading indicator for commercial real estate).
----- Thursday, April 25th -----
8:30 AM: The
initial weekly unemployment claims report will be released. The consensus is for 210 thousand initial claims, down from 212 thousand last week.
8:30 AM:
Gross Domestic Product, 1st quarter 2024 (Advance estimate). The consensus is that real GDP increased 2.1% annualized in Q1, down from 3.4% in Q4.
10:00 AM:
Pending Home Sales Index for March. The consensus is for a 2.0% decrease in the index.
11:00 AM: the
Kansas City Fed manufacturing survey for April.
----- Friday, April 26th -----
8:30 AM ET:
Personal Income and Outlays, March 2024. The consensus is for a 0.5% increase in personal income, and for a 0.3% increase in personal spending. And for the Core PCE price index to increase 0.3%. PCE prices are expected to be up 2.6% YoY, and core PCE prices up 2.7% YoY.
10:00 AM:
University of Michigan's Consumer sentiment index (Final for April). The consensus is for a reading of 77.9.

 From Matthew Graham at Mortgage News Daily: Mortgage Rates Essentially Flat Just Under 5 Month Highs


Recent comments