cps

The Magical Shrinking Unemployment Rate

The September current population survey unemployment report dropped to 5.9% and all sing hallelujah the job crisis is over.  The unemployment rate hasn't been this low since July 2008.  The unemployment rate dropped two tenths of a percentage point in a month, but why it dropped is more interesting.  The main reason is the decline in those participating in the jobs market.

Winter Polar Vortex Didn't Freeze The Unemployment Report

The February current population survey unemployment report is just plain weird and it is not due to weather.  First, the unemployment rate is an artificial 6.7%.  The unemployment rate increased by 0.1 percentage points due to more people being officially counted as unemployed.  Yet, the employment level is basically static, almost unchanged from last month, along with the labor participation rate.

Unemployment Rate 6.7% As Half Million More Not In Labor Force

The December current population survey unemployment report is just plain weird.  First, the unemployment rate dropped another 0.3 percentage points to 6.7%, the lowest unemployment rate since October 2008.  The unemployment rate dropped because over half a million people dropped out of the labor force.  The unemployment rate's dramatic decline for 2013 is due primarily to people no longer being counted.

Unemployment Rate Drops Dramatically to 7.0%

Welcome to the wild weird current population survey unemployment report where dramatic monthly swings cause paranoia and doubt.  We shed light on these woolly figures and this month there is much to flash that light on.  First, the unemployment rate dropped 0.3 percentage points to 7.0%.  This is the lowest unemployment rate since November 2008.

Record Low Labor Participation Rate Not Due to Retirement or School

The October unemployment report showed a record low labor participation rate of 62.8%, graphed below.  Many dismiss these record low labor participation rates by claiming more people are retiring and young people are just in school.  Is this true or is something more sinister going on?

The Majority of New Jobs are Not Part-Time

There are a host of claims out there on part-time work, including this one which claims 96% of all jobs in 2013 are part-time.  Is this really true?  There is no doubt people forced into part-time hours for economic reasons has dramatically increased, as we show every month in our unemployment overview and reproduce below.

Current Population Survey Employment Report in Graphs, Unemployment Rate 7.9% for October 2012

The BLS employment report shows the unemployment rate ticked up by 0.1 percentage points to 7.9%. The reason for this up-tick is more people participated in the labor force in October. We love economic eye candy at The Economic Populist and this overview graphs many of the statistics from the Current Population Survey of the employment report.


Exploring the Wild, Weird World of Employment Numbers From Statistical Space

It's like someone pulled the unemployment rate out of a Star Trek transporter, as if America entered a time warp machine and we moved to another dimension through a worm hole. A 0.3 percentage point drop to 7.8% makes no sense when there were only 114,000 jobs added. Captain, can the unemployment rate be right and we really did defy the laws of statistics?

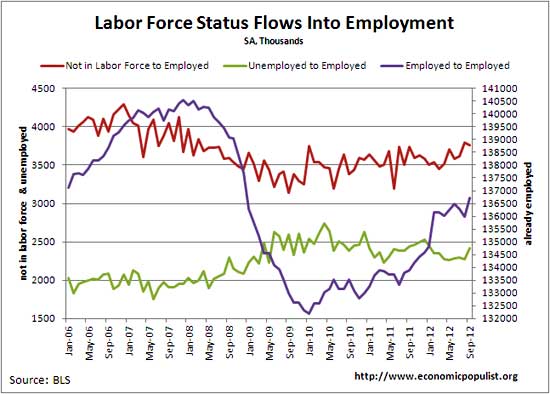
We want to point to something which might in part explain what happened this month with the household survey statistics. That is how long someone holds a job. We don't have monthly statistics on job tenure, yet it could very well be that finally, people are working longer at a job. The never ending Schindler's List attitude towards U.S. workers may have abated. The U.S. has disposable worker syndrome, where people are laid off and fired for no damn good reason at all. It's a fact of the American work life while one has a job one week, there is no guarantee one will have a job the next.

To wit, let's look at another obscure BLS statistic, labor force status flows. This is the number of people flowing from being in the labor force, out of the labor force, employed and unemployed on a monthly basis. Below is a graph of the monthly changes of people who moved into employment from already having a job, not being counted at all, or being part of the official unemployed since 2006.
flows to employment

Pages