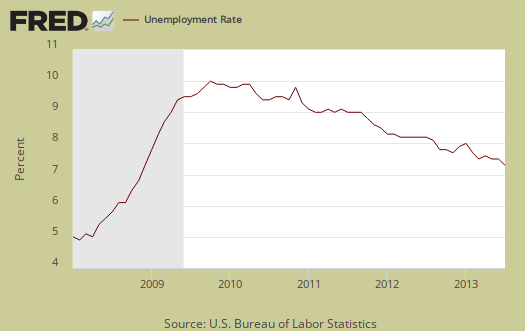
The BLS employment report shows the official unemployment rate declined two percentage points to 7.4%, mainly on a lower labor participation rate and more people being considered not part of the labor force. This is the lowest official unemployment rate since December 2008 and at least a percentage point of the unemployment rate drop is due to the decline in labor force participation. More people were employed as well. People stuck in part-time jobs maintained their increases from last month. Overall the CPS statistics do show a significant increase in those employed over the last year, yet the labor participation rate remains at artificial lows. This article overviews and graphs the statistics from the Current Population Survey of the employment report.
The labor participation rate is now 63.4%, mentioned above. The labor participation rate has declined -0.3 percentage points from a year ago. This implies that those who were dropped from the labor force are staying out of the labor force The -0.3 percentage points represents about 737 thousand people. For those claiming the low labor participation rate is just people retired, we proved that false by analyzing labor participation rates by age.

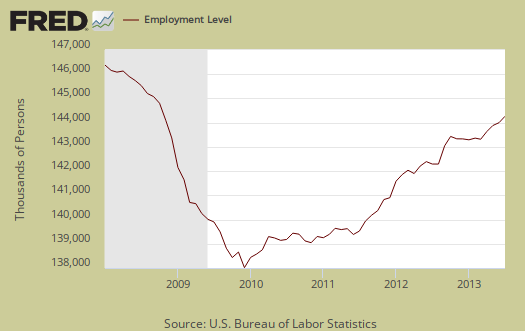
The number of employed people now numbers 144,285,000, a 227,000 monthly increase. We describe here why you shouldn't use the CPS figures on a month to month basis to determine actual job growth. These are people employed, not actual jobs. In terms of labor flows, those employed has increased 2.035 million from a year ago. The noninstitutional population has also increased by 2.402 million during the same time period, so this is actually a good sign that people employed did really increase over the past year. The statistics from the CPS do generally vary widely from month to month, yet two million more employed per annum is still not enough to correct the jobs crisis in America. Below is a graph of the Current Population Survey employed.
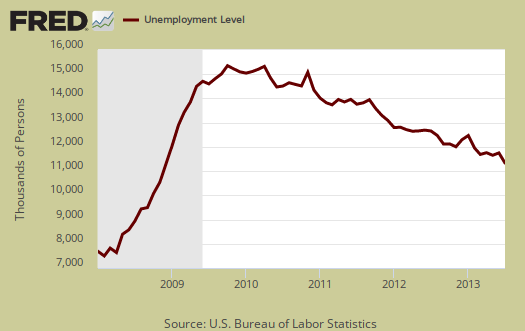
Those unemployed stands at 11,514,000, a -263 thousand decrease from last month. From a year ago those officially unemployed has declined by 1,231,000. This isn't a great showing, especially considering the low labor participation rate. Bear in mind people enter the labor force for the first time and the United States counts foreign guest workers in their employment statistics. This means many people simply fell off of the BLS radar screen for being counted at all and are considered instead not in the labor force. Below is the change in unemployed and as we can see, this number also swings wildly on a month to month basis.

The number of people counted as unemployed has also remained fairly static for years In terms of labor flows we don't see much slope, or change in the number of unemployed. Below is a graph of the unemployed.
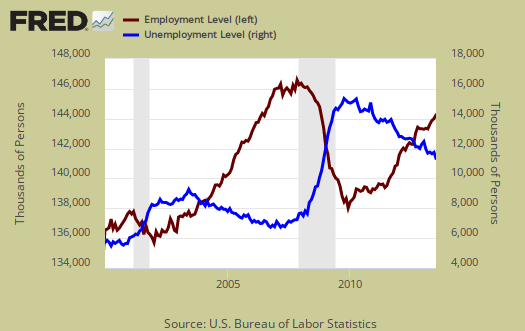
Below is a graph of those considered employed, in maroon, scale on left, against those considered unemployed, in blue, scale on right, by the BLS methods. It is only recently that the growth rate of the employed has exceeded the growth rate of the unemployed (the maroon line exceeding the blue line).
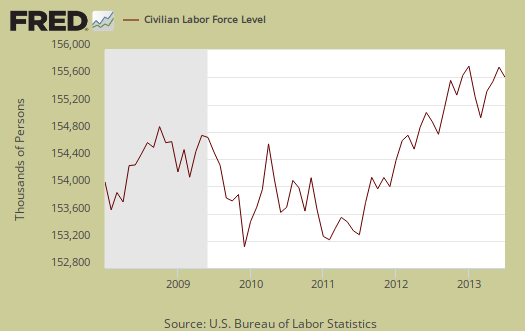
The civilian labor force, which consists of the employed and the officially unemployed, is now at 155,798,000. This is a decrease of -37 thousand from last month, as the drop in the unemployed exceeded those who became employed. The BLS gives reason for unemployment and those who lost their jobs this month dropped by -198 thousand as did those who voluntarily left their jobs, a decline of -51 thousand. People reentering the labor market also declined by -33 thousand and new people into the labor market dropped by -5 thousand. What this means is less people were fired and less people quit and that is the reason for the ranks of the employed to increase. The CPS tells us much more about the flow of labor, as people get fired daily and quit daily in addition to be hired and retired.
Notice in the civilian labor force graph below how many more people are in the labor force than at the start of the 2008 recession. Population increases every month and this post gives details on that increase, while this one describes BLS labor concepts as well as how many jobs are needed just to keep up with the increased population.
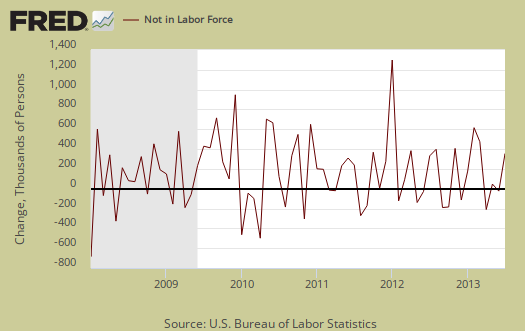
It's fairly clear the American workforce is ending up in the not counted statistics overall, yet for this month, those not in the labor force now tallies to 89,957,000, an increase of 240,000 from last month. From a year ago, those considered not in the labor force has grown by 1.6 million. Below is the change to show on a month to month basis, the CPS shows quite a bit of variance. We talk about the wild monthly CPS changes in this post.
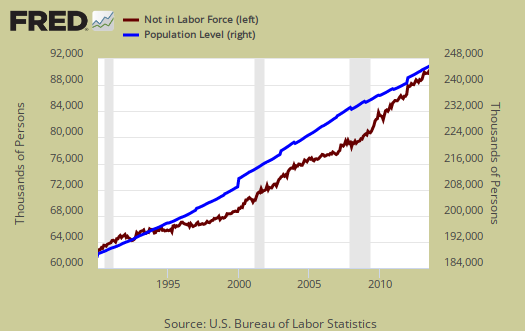
Yet in spite of the wild swings, as a slope, or rate of increase, those not in the labor force grew faster than the population that has the potential to work. Below is a graph of those not in the labor force, (maroon, scale on the left), against the noninstitutional civilian population (blue, scale on the right). Notice how those not in the labor force crosses the noninstitutional civilian population in growth and the accelerated growth started happening right in 2008. This cannot possibly be retirees, all at once and instead a segment of those not in the labor force simply do need work and are not being counted in the official unemployment statistics.
Below is a graph of the civilian labor force, in maroon, scale on left, against those not in the labor force, in blue, scale on right. Notice how those not in the labor force as a trend exceeded those considered employed and unemployed since 2008. It is only recently, in the past few months, where we see the reverse by trend lines, which is a good thing. What we have seen is a never ending growing segment of the population that is considered neither employed or unemployed, i.e. not in the labor force, increasing, above the trend line of those who would be naturally dropping out, such as the retired and those in school. Not in the labor force figures do include retirees.

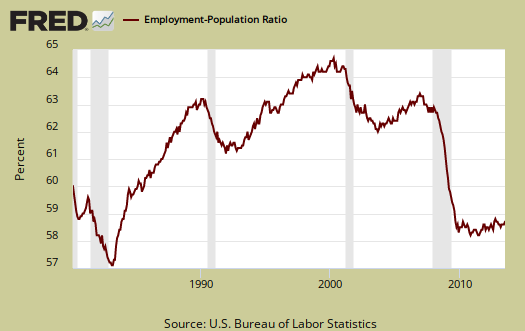
Those considered employed as a ratio to the total Civilian noninstitutional population stands at 58.7%, which is no change from last month. This ratio hasn't been hovering around 1983 record lows for years now. The low ratio implies there are many people who could be part of the labor force who are not anymore, as shown in the graph below.
A huge problem with today's labor market is the gross number of working part-time generally. There are a huge number of people who need full-time jobs with benefits who can't get decent career oriented positions. Those forced into part time work is now 8,245,000, an increase of 19,000 from last month. Those stuck in part-time has no change from a year ago, and this too is not a good sign of the labor market as we would want these figures to decline. This is a hell of a lot of people stuck with part-time hours who need full-time work. Of those considered employed, 27,373,000 of them are working part-time, for whatever reason, including wanting to work just part-time. That's 19% of those working, or almost 1 in 5 employed are working part-time. Before one flips out on this figure, 13.3% of people employed are in part-time jobs supposedly because they want to be.
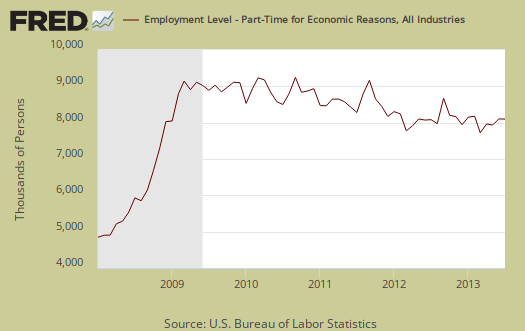
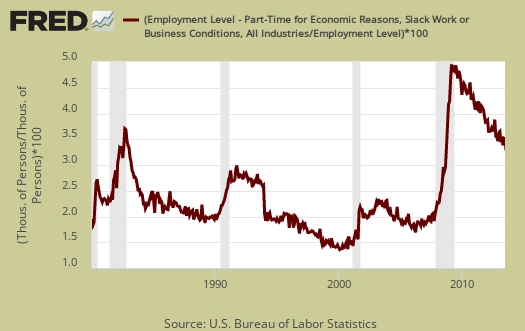
Below is a graph of forced into part-time work because they got their hours cut, graphed as a percentage of the total employed. Part-time due to cut hours is known as slack work conditions and consisted of 5,177,000 people. This is an decrease of -16,000 from last month, yet is still amazingly high considering the reason they are working part-time hours. Below is a graph of forced part-timers due to slack work conditions as a percentage of the civilian labor force. We think this graph is a recession economic indicator, and notice the slope matches strongly the gray recession bars of the graph. The percentage of people in working part-time due to slack economic conditions has stayed extremely high since the start of the Great Recession, now going on six years.
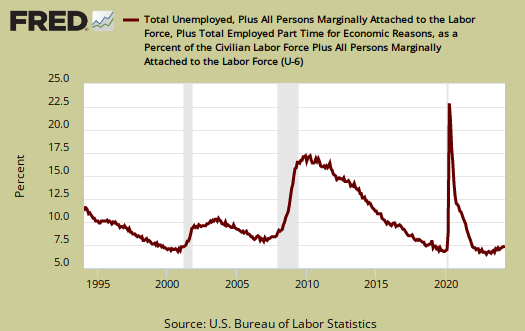
U-6 is a broader measure of unemployment and includes the official unemployed, people working part-time hours because that's all they can get and a subgroup not counted in the labor force but are available for work and looked in the last 12 months. Believe this or not, the U-6 alternative unemployment rate still leaves out some people wanting a job who are not considered part of the labor force. U-6 dropped -0.3 percentage points to 14.0%. This month's drop in the U-6 figure is mainly due to the official unemployment rate decline.
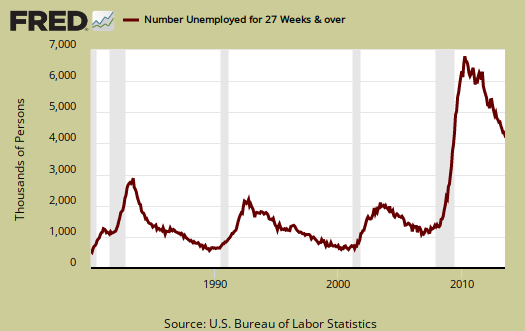
The long term unemployed, or those unemployed for 27 weeks and over, stand at 4,246,000 people. This is a decrease of -82,000 from last month. The long term unemployed are the crisis of our time and this figure decrease does not necessarily imply those unemployed for a long time are actually finding jobs. The long term unemployed have decline by -921 thousand from a year ago..
The marginally attached are people not in the labor force because they have not looked for a job in the last month, but have looked for a job in the last year. This number has ballooned since 2007 and not returned to pre-recession levels. The graph below is the number of people considered marginally attached to the labor force, currently at 2.414 million. Those marginally attached has barely budged from a year ago, a decrease of -115 thousand. In other words, the marginally attached figures just are not dropping as they should.
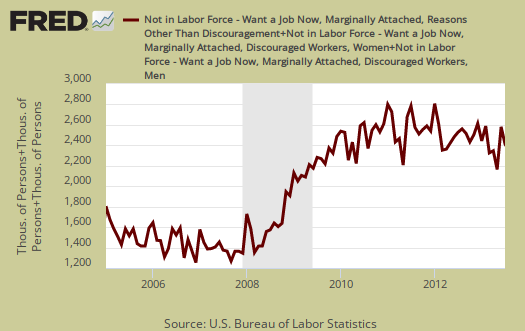
Discouraged workers are people, not counted as part of the civilian labor force, who not only want a job, but also looked for one in the last year. These people aren't job hunting now because they believe there are no jobs out there. Below is the graph of discouraged workers, currently at 988,000 people and are a subset of the marginally attached. Discouraged workers is kind of a barometer for how the job market is perceived. This is an increase of 136,000 people from a year ago.
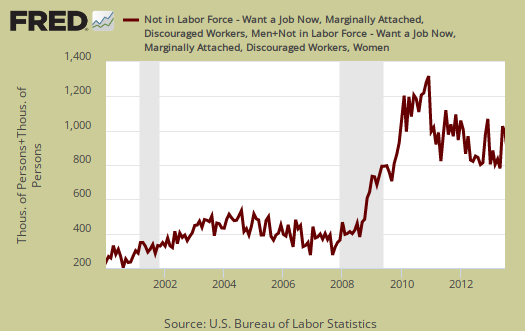
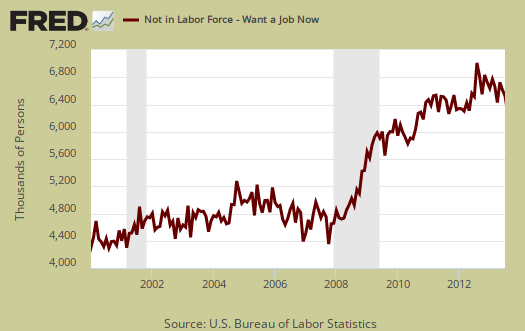
One of our favorite statistics from the CPS survey is how many people who are considered not in the labor force, want a job now. It is a direct survey question from the CPS. The survey asks people who are not being counted in the unemployment statistics and official unemployment rate if they want a job. The number who answer yes currently stands at 6,619,000. A year ago this figure was 6,587,000. In other words, not much has changed and there are an astounding number of people not counted who report they actually want a job and roughly 2.3 million higher than before the recession. This figure includes the discouraged workers and marginally attached, but is seasonally adjusted, unlike the above.
The average length of unemployment is now 36.6 weeks, a a full week increase from last month. Over half a year is an absurdly long amount of time to be unemployed and has stayed highly elevated for years. The average duration is also so high due to the long-term unemployed who represent 37% of the unemployed. Many face age discrimination as well as discrimination for the fact they need a job, one of the worst injustices in America.

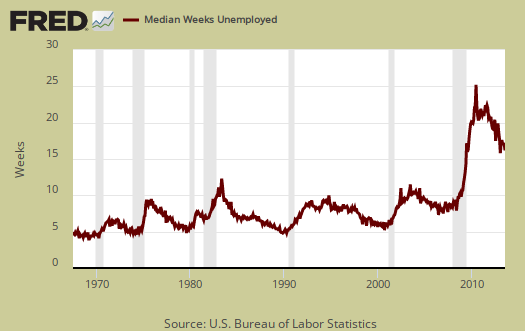
The median time one is unemployed, which means 50% of people have gotten a job in this amount of time, and is 15.7 weeks, a decrease of 0.6 weeks from last month. Both the average and median duration declines can be attributed to the decrease in those unemployed long term.
Those unemployed less than five weeks decreased by -129 thousand, those unemployed between five weeks and 14 weeks increased by 5 thousand and people who had been unemployed for 14 weeks to 26 weeks decreased by -108,000. As previously noted, the long term unemployed decreased by -82 thousand. . A drop in the unemployed does not necessarily mean they found a job, although the decline in recent unemployed and a low increase in the next time period is a better sign.
People join the ranks of the unemployed because they were laid-off, fired, they quit, the job was temporary and thus ended, they entered the labor force for the first time and re-entrants. Re-entrants are people with work experience, yet have been considered not in the labor force for some time. Recall to be considered unemployed one has to be actively searching for a job. As a percent of the unemployed, re-entrants are at a lower percentage.

Yet if one looks at the levels of re-entrants, or people considered not in the labor force who started actively looking for a job again, the levels are at all time highs. This is yet another sign on how people are not finding work, giving up, then dropping out of the labor force and then trying again to get a job. If the job market was good, we would not see record levels of re-entrants as shown in the below graph.
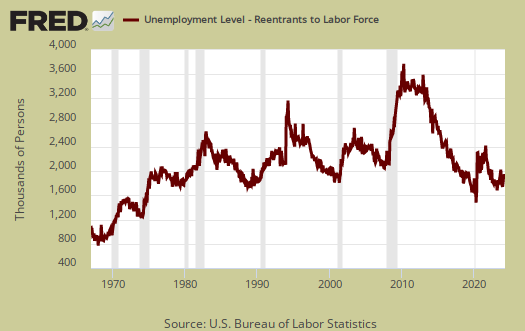
Here is our overview of last month's CPS unemployment statistics.

QUESTION:
I'm confused...If we now have 11.5 million unemployed, and 4.2 million of them are "long-term" unemployed (27 weeks or longer), does than mean 7.3 Americans just recently lost their jobs since this past February?
Answer
First, do not round. The figures are listed in the above post and for intermediate calculations one needs the full 4 significant digitis. The CPS has an margin of error on the final figures of about 400,000.
The correct figures, as listed in the above post are:
Long term unemployed: 4,246
Total unemployed, which will NOT match the tally of the duration figures due to differences in statistical methods. In other words, there are probably some unemployed where they do not report their duration and so we have different survey questions with different sums as a result.
REASONS for entering the ranks of the unemployed:
New entrants,
Re-entrants
completed temporary jobs
Laid-off/fired
Person quit their job
The BLS mixes temporary jobs and permanent job losses through firing/layoffs together in one tally.
Reentrants are people who have been not in the labor force but do have work experience. In other words, these are people who are no longer counted but then started actively looking for work again and thus are called re-entrants.
This figure has been statistically high and is 3,258,000 for July 2013.
So, no, you cannot just subtract off the long term unemployed and get layoff figures, not even close, there are all sorts of pathways to enter into the counted unemployed.
I added re-entrants to this overview so you have two graphs on it now.
Folks, I do go into nitty gritty and thus this overview is dense, please ask questions, start discussion in the comments. Odds are if something is confusing to you, it is confusing to lots of other people too chicken to write a comment.
Levels of Unemployemet
Based on your analysys:
Yet in spite of the wild swings, as a slope, or rate of increase, those not in the labor force grew faster than the population that has the potential to work. Below is a graph of those not in the labor force, (maroon, scale on the left), against the noninstitutional civilian population (blue, scale on the right). Notice how those not in the labor force crosses the noninstitutional civilian population in growth and the accelerated growth started happening right in 2008. This cannot possibly be retirees, all at once and instead a segment of those not in the labor force simply do need work and are not being counted in the official unemployment statistics.
A NATION WITHOUT LIBERTY IS A NATION WITHOUT PROSPERITY.
The other factors other than re-entrance into the job market. Re-entrance increase signifcantly and the workforce participation rate declines. What is missing from this picture. For comparitive econimcs, USA has one of the lowest OECD labor participation rates. The most comparable economy, Australia, has a 66.3%rate. We could compare the US to Germany or Switzerland, nations, democratic nations whose police have no unquestioned juridical right to read your email, phone records, without help of our intelligence agencies.
Other actual republics whose legislatures have the right to question entrance into wars.Nations like Switzerland , with a 83% labor participation rate. Or even Germany with 78% labor participation rate.
My criticism of Snowden was that he was too tame in criticizing the BEAST, which affords us neither liberty not properity. Yet the BEAST pleads for it's unconstititutional entrusions. Let me remind those with short memories of Daniel Elsberg's revalation of the Penatagon Papers. Daniel revealed how the Pentagon deceived each POTUS from Truman to Nixon into beleiving the Greater South Asian War must continue indefinitely,
whether victory was in sight or not. Elsberg had the wisdom to dump documents to the NY Times.
So, to the National Security Brigade of the North American Military Republic (formely know as USA). I offer the folllowing. Before you procecute Snowden. Please prosecute me for treason or other offenses for revealing your corrupt practices.during the occupation of the U.S Embassy in Tehran. In late 1978, the U.S, the U.S. State Department and the U.S Treasury under the Honorables Al Haig, and Donald Reagan conspired to cover up the illegal arms transfers both to the forces of the SAVAK, and to the insurgents of Khomeni. Playing both sides. Is there a better descritption of a corrupt regime? That corrupt regime is not the Ayatollah's.
So how did the U.S describe the illegal arms sales to Khomeni Forces and the Savak?
They made the operatives of the U.S. Embassy sign confessions for illegal arms sales to both sides in the Iranian Revolution. These confessions were made on their US Federal Tax Returns Schedule D. Unlike a normal Schedule D, these documents contained long text narratives of arms transactions with both the SAVAK and Khomeni forces. Same
"intelligece" opreratives are selling arms both to sides, Motives for cover-up are inevitable.
How could we be certain. My signature and stamp is on each documet of your
governments crime?. Documents are in the Bayonne NJ Archive.
So how could these documents be hidden? A notorious character known as Big Bird
communicated the threats to me personally. If you go to the NY Times, it will be your undoing. If you play the game, you will be rewarded. Big Bird, a participant of a NJ volunteer fire department suggested that life on the welfare system of the 1980s of the Reagan years would be far less prosperous than Federal Employment.
Like Daniel Elsberg, unlike Snowden, i do not fear the pathetic, corrupt regime which
hides these crimes. To return to the orignal subject,their biggest crime is tolerance
and deliberate creation of mass unemployent, for their obvious objectives. This is a regime with a shelf life too obvious to state.
Burton Leed
Labor Capacity Utilization
The definitive measure of EMPLOYMENT (as opposed to the relatively useless and endlessly slippery notion of 'unemployment') is our nation's Employment Ratio. It is, quite simply, the fraction of our working-age, civilian population that's actually employed.
While we can argue endlessly about what that number 'should' be -- there's absolutely NO argument about where it plunged to upon our Great Recession -- or the extent of its recovery since then -- or the utility upon that measure of the $$ 16 trillion or so lavished upon our financial industry. See the chart of this metric, and judge the progress for yourself on http://research.stlouisfed.org/fred2/series/EMRATIO
labor capacity utilization answer
The graph you list is presented above, it is the civilian employment to population ratio.
It is horrific and why we go over it and we also agree, anyone arguing over this figure as well as the labor participation rate figure as not showing horrific news for the U.S. worker is smokin' crack, delusional or on the corporate lobbyist spin machine payroll.
The "plunge" is why we graph up almost every employment statistic back to 2008. How can one deny the plunge yet, over and over again, we get politicians trying to and spinning this horrific decade long crisis into some sort of "structural" bogus claim.
math
Is this line missing the word thousands instead of just "730 people"? "This implies that those who were dropped from the labor force are staying out of the labor force The -0.3 percentage points represents about 730 people."
math corrected
Yes, it is 737 thousand people. The labor participation rate is the civilian labor force divided by the civilian noninstitutional population.
245,756 * 0.003 = 737,268.
Since it's a ratio, we take the most recent figures to calculate, but because it's a rounded ratio, it's about 730 thousand.
Thanks for that. We calculate from the data and sure don't mean to confuse the complexity by introducing typos!