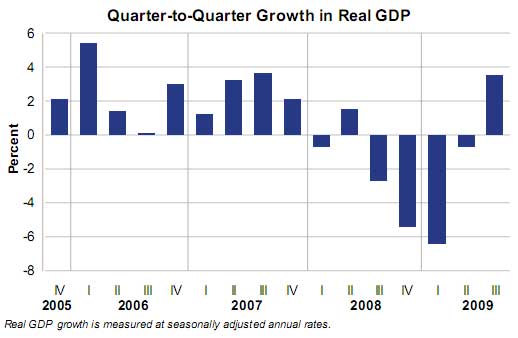
GDP hit 3.5% in Q3 2009.

Src: BEA
Yea, Yippee! What's behind the numbers?
A reminder, GDP is:
where
Y=GDP, C=Consumption, I=Investment, G=Government Spending, (X-M)=Net Exports.
So, what components of GDP contributed to such a nice increase of economic growth? In Q3:
- Price index - +1.6%
- Consumption - +3.4%
- Durable Goods - +22.3% (cash for clunkers)
- Nondurable goods - +2.0%
- Non-Res. investment - -2.5%
- Residential Fixed Investment + 23.4%
- Exports - + 14.7%
- Imports - +16.4%
- Gov. spending - +7.9%
- Private Inventories - + 0.94%
So, Consumption, contributing 2.4% of the Q3 GDP, and gross private investment (at +11.5%) were the reasons GDP increased. So in other words, people bought new cars on cash for clunkers and bought more overpriced (still) houses with a first time home buyer's tax credit and distressed sales.
Great. Pom poms back in.
Personal income decreased -0.5% in Q3. Disposible personal income: -0.7%, yet get this, personal outlays increased +5.8% and the personal savings rate dropped to +3.3%.
Ok! So Americans personal income continues to drop but who cares, they are consuming more...
Wasn't this out of balance economy the original problem?

Yeap.
The good and the bad. The DPI and savings numbers are very interesting.
RebelCapitalist.com - Financial Information for the Rest of Us.
RebelCapitalist.com - Financial Information for the Rest of Us.
cash for clunkers
EconomPic has a beyond belief graph here showing just how much the auto output changed Q3.
I hope the stimulus was designed
in a way that starts with tax incentives to provide the initial shot followed by more employment intensive stimulus. I hope.
RebelCapitalist.com - Financial Information for the Rest of Us.
RebelCapitalist.com - Financial Information for the Rest of Us.
Yes, but
Good post, but combine that with the $24,000 per clunker reported by edmunds and (1) not only did we go further in debt, (2) Q4 should be very low.
My take is http://learnecon.blogspot.com/2009/10/government-purchases-35-growth-rat...
Steven Myers, good insight!
I just went to your blog and read your analysis. Very good addition and I esp. like the conclusion the government just "bought" a good GDP report.
What I find astounding is precisely how giving a $4500 rebate instead manages to add $24k in costs to each vehicle.
Your government "at work"?
Just so you know, EP is a community blog, so if you would like, you can create an account and cross post (see the User guide on a few requests to "fake out" the Google for it doesn't like duplicates on the Internets) here.
Alice in Wonderland
Point of Interest…
Morning headlines in the Rochester, NY "Democrat and Chronicle" (Gannett paper):
1. “U.S. economy shows growth in third quarter” - with the same accompanying bar chart as above.
2. “12,000 KODAK EMPLOYEES AND THOUSANDS MORE RETIREES MIGHT PAY MORE FOR HEALTH CARE IN 2010”
I feel like Alice in Wonderland: "What's down is up. What's up is down."