Oh woe to the American worker! The revised Q4 2009 Productivity & Costs BLS report gives some horrific news in terms of job creation and sharing the wealth for the U.S. worker. Firstly, a reminder on how labor productivity is calculated:
Labor productivity, or output per hour, is calculated by dividing an index of real output by an index of hours of all persons, including employees, proprietors, and unpaid family workers.
When you see soaring productivity, with reduced or low output and unit labor costs down, that means the U.S. worker is getting royally screwed.
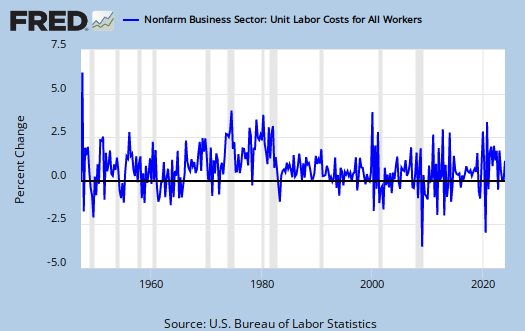
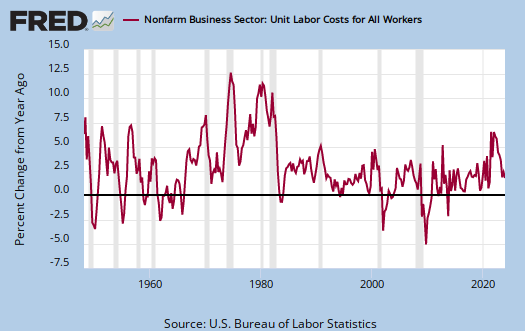
Unit Labor costs dropped 1.7% on an annual basis, the largest on record!

From the same quarter, one year ago, a drop of 4.7%, the largest since 1948!

Nonfarm business sector labor productivity increased at a 6.9 percent annual rate during the fourth quarter of 2009, the U.S. Bureau of Labor Statistics reported today. The gain in productivity reflects a 7.6 percent increase in output partially offset by a 0.6 percent increase in hours worked. From the fourth quarter of 2008 to the fourth quarter of 2009, productivity increased 5.8 percent as output declined 0.2 percent and hours fell 5.7 percent. The annual measure of productivity increased 3.8 percent from 2008 to 2009.
So, this is not good news and we should demand to get our government to statistically aggregate jobs created offshore and moved offshore at this point, employment based on citizenship status as well is needed. While many economists might claim this is the bottom of the U.S. worker squeeze, don't bank on that one. Firstly we have to see an increase in domestic demand and then, we need businesses to hire U.S. citizens, LPR to meet that rising demand. Don't let them claim this is all technological advances either. No way in hell has technology advanced so quickly as to displace and squeeze U.S. workers to this degree in one year. It's globalization frankly and ya know what, Wall Street won't breath a word about it! They love their global labor arbitrage to the point it's almost their religion!
For all graphs on productivity and costs, please click on this link to Productivty and Costs, Q4 2009. All graphs are updated automatically in this month old post, so the graphs now reflect the revised figures.
Subject Meta:
Forum Categories:
| Attachment | Size |
|---|---|
| 176.79 KB |

Recent comments