The August Consumer Price Index, which measures inflation, increased 0.4% from last month. Food increased 0.5% and energy 1.2%. Core CPI, or price increases minus food and energy costs, rose 0.2%. Core CPI is a Federal Reserve inflation watch number. For the year, not seasonally adjusted, the Consumer Price Index for all Urban Consumers (CPI-U) has risen 3.8%. In July CPI also increased by 0.5%.
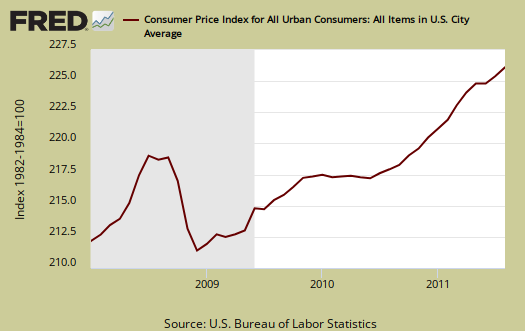
The yearly numbers on core inflation are hitting increase percentages which occurred before the late 2008-2009 deflationary period, which was caused by a global slowdown. From the CPI data release:
The 12-month change in the all items index edged up to 3.8 percent after holding at 3.6 percent for three months, while the 12-month change for all items less food and energy reached 2.0 percent for the first time since November 2008. The energy index has risen 18.4 percent over the last year, while the food index has increased 4.6 percent.
Below is the monthly percentage change in CPI-U, all items. U stands for Urban consumers.
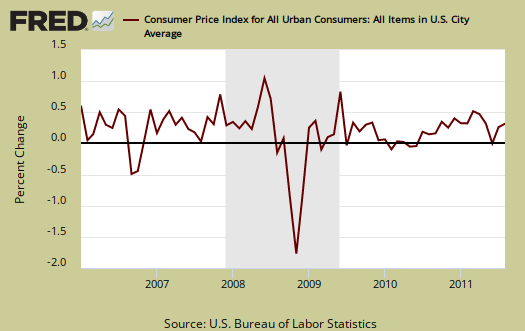
The core CPI, or all items less food and energy, percentage increase same as last month. Shelter is up 0.2%, with rent increasing 0.4% and home owners equivalent rent of primary residence also increasing 0.2%. Medical care increased 0.2%, clothing up 1.1%, used autos increased 0.9%, but new cars was flat, or no change from July. Hotels, motels decreased -1.8%, furniture increased 0.3%, public transportation increased 0.6% and education up 0.3%. Renting increasing is a reflection of the housing market, an increased demand for rentals.
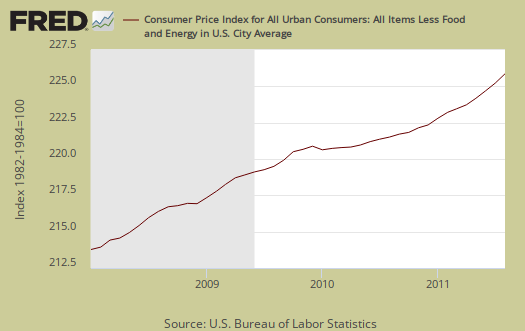
Core CPI's monthly percentage change is graphed below. As we can see, overall, without energy and food, inflation for the 4th time is showing up. If you're wondering why the percent changes are different from July, it's because the graphs and hand calculations have two decimal places of accuracy, whereas the CPI report rounds percentages to one decimal place.

Below is the St. Louis FRED graph to show the overall index on core CPI, or CPI without food and energy included. We are seeing an acceleration uptick in core although the recession, which includes the last 2008-2009 portion of the graph was deflationary.
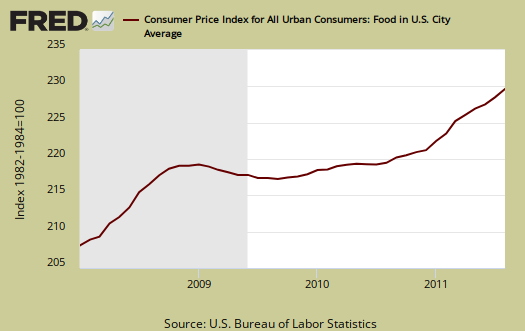
Food and beverages as well as groceries increased, 0.5% in August and the food index is up 4.4% for the year. Food at home, or groceries, increased 0.6% and is up 6.0% for the year. Dairy increased 0.9%, baked goods, 1.1% (which could be reflected in wholesale eggs). Weird, fats increased 0.9% and is up 10.8% for the year and sweets increased 1.2% for August. Just what we need, an increase in the demand for sugar and fat? The graph below is food, which includes food at home and restaurants.
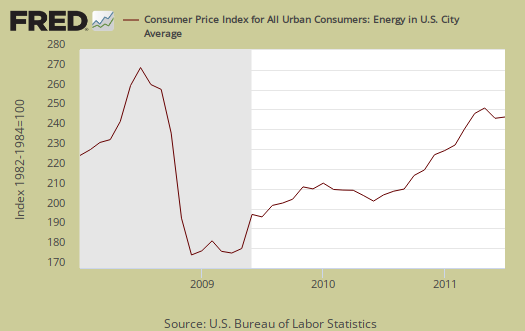
Energy overall increased 1.2%. Gas alone increased 1.9% for August and is up 32.4% for the year. That said, the report notes before seasonal adjustment, gas dropped -0.5%. While the seasonal adjustment algorithm has an intervention adjustment for major events, like Hurricanes, it's unclear if it took into account events like Libya on gas prices this report. Household energy increased 0.4%. Below is the CPI-U Energy Index.
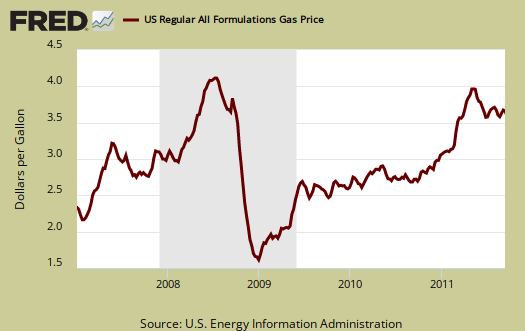
Below are gas prices, last updated September 12th. Notice the oil bubble in early 2008 and notice how close gas prices are now to that previous oil bubble. Bear in mind this CPI report is for August.
The CPI energy index, capturing the last oil bubble below, is all energy, gas, natural gas, fuel oil and so on. Notice it's dip and return versus the food index as well as how it's not as high as the CPI energy index was during the oil commodities bubble of 2008.

The Medical index increased 0.2% for the month and Medical care increased 0.2%, with services increasing 0.3%. Medical commodities are things like your prescription drugs and it increased 0.1% from last month. Strange isn't it, that Medical care is never mentioned when referring to costs and inflation. It's only as important as food, yet health care is treated almost like it's an extra for daily living. For the last six months hospitals are up 6.1% while personal computers, cell phones are down -13.6%. So you may not be able to get medical care, but good lordy, you can blog about it.
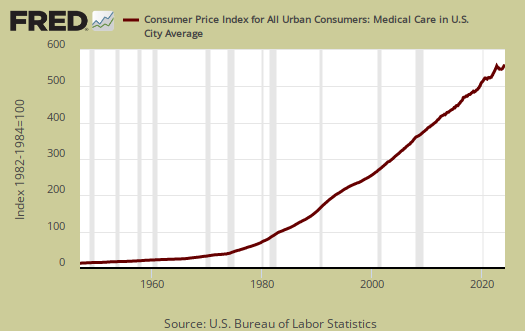
There has been much criticism as of late that the Federal Reserve only focuses in on core CPI, instead of food and energy. According to the BLS, Food and beverages, which includes food at home, makes up 14.8% of the index. Housing is 41.5% and transportation, including gas for the car, is 17.3%. Medical care is only 6.6%, which frankly, we hope to examine later as not being a reality percentage. All items minus food and energy are considered 77.2% of the total price expenditures for consumers.....according to them.
Regardless, this increase in core CPI will probably get the Fed's attention.
The DOL/BLS does take yearly surveys on where the money goes in the monthly budget, but as one can see, food and energy are significant amounts of the monthly finances. Run away costs in these two areas can break the bank. Considering we have price deflation in housing due to the real estate sector bubble pop, it's strange for food and energy consumer prices to be dismissed when crafting monetary policy, dismissed as volatile. A year of data to me, isn't volatile enough to dismiss, especially when these are key critical needs for regular people.
CPI-W for the month, unadjusted was 223.326 , a +0.3% increase from last month and a 4.3% increase for the year. CPI-W is used to calculate government transfer payments, such as social security increases.
Note the the chained CPI-U also increased 0.3%, 3.6% for the year and this is not seasonally adjusted. Chained CPI is in 2005 dollar values, which has a flattening effect on real inflation, thus flatting cost of living adjustments if used.
This report is from the BLS website. These numbers are for CPI-U, whereas the metric used to calculated social security and other government payments is CPI-W.
Last month's CPI report overview, unrevised, although most graphs are updated, is here.

"Do chickens have cycles?"
Robert Oak asked question in comment at August 2011 PPI -- "Co chickens have cycles?"
That question can be definitively answered: "Yes ... but maybe it doesn't matter."
The question further is about increases in price of baked goods and how that relates to wholesale eggs. To answer that question, we would have to find numbers for powdered eggs versus fresh eggs.
Of course, no baker worth his salt would admit to using powdered eggs ... and, if you've ever tried powdered eggs, you'll understand why. I suspect that in this instance, wholesale eggs price changes are about two factors: weather and related energy costs, and, imports from Canada.
I'm thinking that if you have severe heat in your egg factory in Texas, it's going to cost a lot to keep your artificial environment going, and you just have to raise your bottom-line price. Or, buyers could decide to buy from Canadian producers instead, but the price would still be up a little.
Some years ago (of course) I used to buy eggs by the small truckload at what was considered to be a more-or-less natural or humane egg factory. (Contradiction in terms, I know.) The layers were batteried but not to the extremes of most 'factory farms'. The farm claimed to have better eggs than other (less naturalistic) factory farms. For sure they did not artificially color the yolks or anything like that. They also claimed that by giving the hens more room to move, cannibalism was reduced and they did not need to feed them so much in the way of anti-biotics. Their layers actually had two legs each! Light was partly natural, so the layers molted in the natural cycle, that is, in the fall.
MOLTING AND SUPPLY CYCLE
Like their wild ancestors, free-range and backyard layers molt in the fall, which means in March or April in the great Down Under. So, if it's worth it to import eggs from across the world, you could offset the natural cycle. (I'm not sure what happens in the tropics.)
Mainly though, eggs store easily for 60 days, so cyclic effects aren't all that significant, although there has long been an annual price cycle reflecting supply cycle.
Of course, what happens in USA (in the factory farms) is forced molting. That's a huge topic in poultry farming. Also, there's all kinds of genetic modification going on, especially about bird flu -- which was a big scare a couple of years ago. It's a complicated public health topic. It may be that there's a trend toward increasing eggs prices exactly because of the bird flu thing. All that research and experimentation has to be paid for.
LOCAL EGGS
I have friends who raise chickens for eggs to sell at farmers' markets locally. There's a pretty good and probably increasing demand for "local eggs" that short-circuit the normal food distribution supply chains. Most egg farmers who go the more natural food route, plan on a fall molt and slaughter many birds at that time. That's definitely what typical backyard growers do, but some small-medium-size operations bring in specialists to do the slaughter and butchering. The real deal is fertilized eggs, with real roosters. Now that's free range!
EGG IMPORTS
There's a huge program ongoing to regulate importation of hatching eggs, which are considered as live poultry imports. This has to do not only with bird flu but also with other poultry diseases or poultry-vectored pathogens.
USDA on hatching eggs imports
There's a hue-and-cry about animal rights activists who would like to illegalize the battery-system (factory-farm or, euphemistically, "caging") system of egg and poultry production. The industry responds with the globalization defense: "It would drive some egg production to countries like Mexico without such a ban, and result in imports of eggs produced under different food safety, welfare and environmental standards."
Obviously, USA gave away all regulatory authority at the Uruguay Round years ago

See, UnitedEgg PDF
I haven't found a neat source for egg imports up to date, but generally, 90% of USA imports of eggs and egg products is from Canada and that totaled some 22.4 million pounds in FY 2010. So, USA imports something like 2 million pounds of eggs and egg products every month, mainly from Canada.
That means that wholesale egg price numbers are influenced by exchange rate of USD versus CanD -- or expectations of exchange-rate changes.
good egg!
I was being sarcastic, get it, eggs, cycles? ;) but that's some very interesting additional info on egg markets that I sure didn't know.
Thanks.
Also, I disabled comments on the PPI thread because the site is currently getting attacked by spammers trying to get on the site.
There are little scripts that try to post comments, which look like real comments but are links to scam/malicious sites and also they think this increases their site page rank.
I'm working on code to block them as I type. What a big pain.