
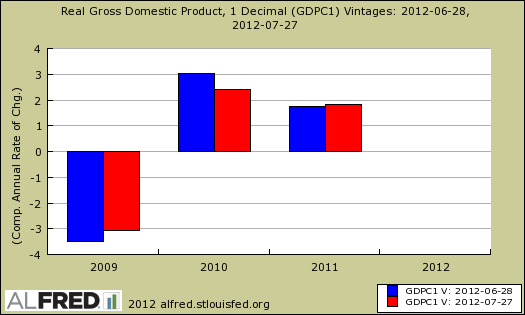
With the release of Q2 2012 GDP, we had a slew of shocking revisions, going back all the way to Q1, 2009. How can this be? How can gross domestic product be wrong, three years after the fact? Below is the original GDP reported (blue) and the new with revisions (red).

Overall the revisions show the recession was less deep and the recovery even more shallow. The United States seems permanently in the economic doldrums.
The percent change from the preceding year in real GDP was revised up from a decrease of 3.5 percent to a decrease of 3.1 percent for 2009, was revised down from an increase of 3.0 percent to an increase of 2.4 percent for 2010, and was revised up from an increase of 1.7 percent to an increase of 1.8 percent for 2011.
For the period of contraction from the fourth quarter of 2007 to the second quarter of 2009, real GDP decreased at an average annual rate of 3.2 percent; in the previously published estimates, it had decreased 3.5 percent.
The reasons for revisions are multi-fold. Unfortunately, in this day where Google knows where you are at every minute, stores know exactly what kind of TP you use and even if you are pregnant, unfortunately our government has to estimate a huge amount of economic data with actual statistics having a very long time lag and we still have massive raw data holes. Yes folks, that's right, our government is not Visa or MasterCard.
First, annual surveys have benchmarks, which is a glorified way of saying do over, where they adjust whatever errors that had going on in a one shot deal. For example, the monthly manufacturer's survey (M3) has a yearly requirement all manufacturers report their figures. On the monthly, no such luck, statisticians have to extrapolate and this is why there are yearly revisions.
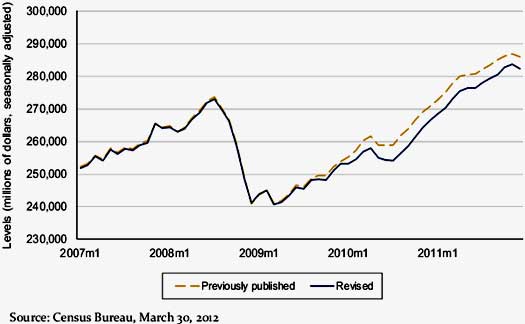
Case in point, Retail sales was seriously over reported as illustrated in the below BEA graph of retail sales revisions, excluding motor vehicles.
Then, there are estimates and actual data. State & local spending have a two year lag in actual reporting. Corporate and other business entities also have a two year lag, this time the data comes from the IRS. There were also improvements in PCE, or consumer spending with new data being collected by the Census.
What's more scary, in terms of really knowing what's going on with the U.S. economy, next year everything is up for revisions, going all the way back to 1929!
Worse news, both personal income and corporate profits were revised down for all three years.
Corporate profits from current production -- profits before tax with inventory valuation and capital consumption adjustments -- was revised down for all 3 years: $19.7 billion, or 1.4 percent, for 2009; $97.7 billion, or 5.4 percent, for 2010; and $115.8 billion, or 6.0 percent, for 2011. For 2009, downward revisions to profits of domestic financial corporations and to profits from the rest of the world were partly offset by an upward revision to profits of domestic nonfinancial corporations. For 2010 and 2011, downward revisions to profits of domestic financial and nonfinancial corporations were partly offset by an upward revision to profits from the rest of the world.
Profits before tax was revised down for all 3 years: $15.2 billion for 2009, $3.2 billion for 2010, and $42.2 billion for 2011. The before-tax measure of profits does not reflect, as does profits from current production, the capital consumption and inventory valuation adjustments. These adjustments convert depreciation of fixed assets and inventory withdrawals reported on a tax-return, historical-cost basis to the current-cost measures used in the national income and product accounts. The capital consumption adjustment was revised down for all 3 years: $7.0 billion for 2009, $94.9 billion for 2010, and $71.2 billion for 2011. The inventory valuation adjustment was revised up $2.6 billion for 2009, was revised up $0.4 billion for 2010, and was revised down $2.5 billion for 2011.
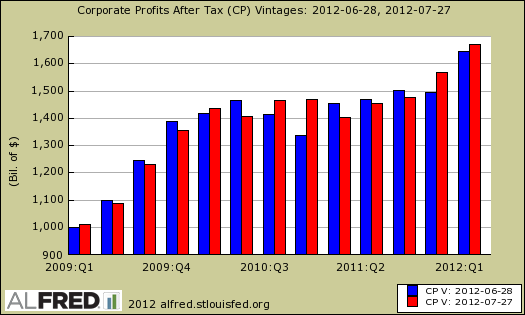
Yet, check out corporate profits after tax. Look what was revised upward for 2011.
Personal income will be covered in more detail with the next release. For now, here is the BEA report text.
Personal income was revised down for all 3 years: $63.2 billion, or 0.5 percent, for 2009; $51.6 billion, or 0.4 percent, for 2010; and $43.9 billion, or 0.3 percent, for 2011. For 2009, downward revisions to personal dividend income, to rental income of persons, and to personal interest income were partly offset by an upward revision to nonfarm proprietors’ income. For 2010, a downward revision to personal dividend income was partly offset by upward revisions to nonfarm proprietors’ income and to personal interest income. For 2011, downward revisions to personal dividend income, to government social benefits to persons, and to farm proprietors’ income were partly offset by upward revisions to nonfarm proprietors’ income, to supplements to wages and salaries, and to personal interest income.
Disposable personal income (DPI) (personal income less personal current taxes) was revised down for all 3 years: $66.4 billion, or 0.6 percent, for 2009; $52.6 billion, or 0.5 percent, for 2010; and $44.2 billion, or 0.4 percent, for 2011. Personal current taxes was revised up for all 3 years: $3.2 billion for 2009, $0.9 billion for 2010, and $0.3 billion for 2011. The percent change from the preceding year in real DPI was revised down from a decrease of 2.3 percent to a decrease of 2.8 percent for 2009, was unrevised at 1.8 percent for 2010, and was revised up from an increase of 1.2 percent to an increase of 1.3 percent for 2011.
From the NIPA revisions briefing we have some great graphs showing what has really changed in the economy. Below is a graph of GDP components and their percent change, annualized from Q4 2008 to Q1 2012.
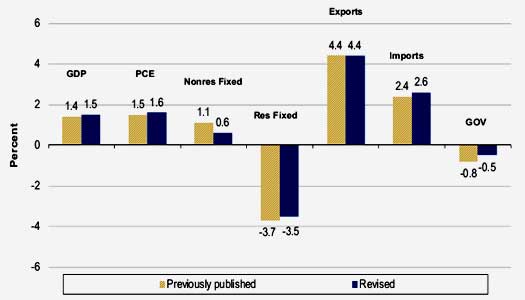
First thing to note is even with revisions, 1.5% real GDP growth is pathetic. The other thing to notice is how much the housing bubble implosion hurt the economy. Then, for all of the rhetoric claiming rising exports is good and it is good, it's clearly not enough growth to save the economy.
Economic growth is even worse for 2008-2011, where real GDP only increased on average 0.3%, annual rate.
What's the bottom line? The U.S. economy is stagnant, now going on four years, the revisions to GDP reflect that.
Recent comments