
January 2012 Retail Sales increased 0.4%. Minus autos & parts, retail sales increased 0.7%. December retail sales were revised down from 0.1% to 0%, or no change from the previous month. Retail sales are up 5.8% from the same time last year. Retail sales are reported by dollars, not by volume, so dropping prices often reports as a decline in sales.
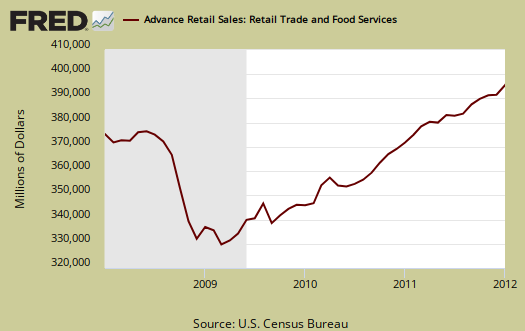
Total retail sales are $401.4 billion for January. Gains in other retail sales categories offset a major drop, -1.3%, in auto sales from December. Auto sales are a subcategory of motor vehicles & parts, which showed a -1.1% overall change.
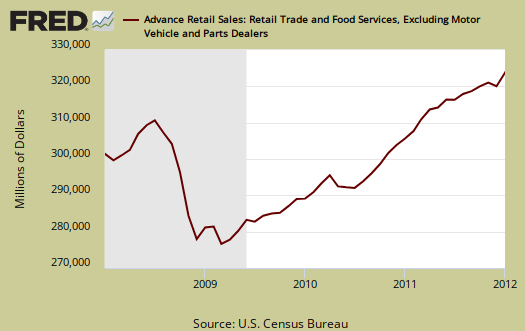
The below graph is retail sales minus autos & parts. Retail sales minus autos & parts increased 0.7% for January and are up +6.0% since this time last year.
Below is the monthly percentage change of retail sales categories.
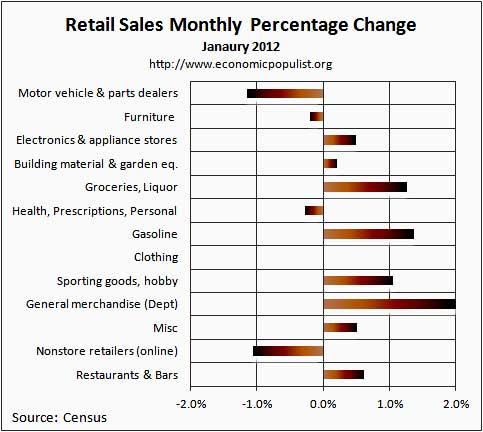
Gas sales increased 1.4% from December and are up 7.4% in comparison to January 2010. Grocery retail sales increased 1.3% for the month and have increased 4.3% from this time last year.
Strange but true, general merchandise stores increased 2.0%, while department stores, part of general merchandise stores category, increased 1.0% in January. This is the month after the holidays, so perhaps we have major bargain hunters? Retail sales are seasonally adjusted, thus the holiday rush is already adjusted for.
Nonstore retailers plunged, -1.1%, but are up 4.9% from the January previous. Nonstore retailers are online shopping, mail order, door to door. Online shoppin' is roughly 76% of nonstore retail sales. It's clear e-shopping is increasing in market share and is becoming a large factor in overall retail sales.
Retail trade sales are retail sales minus food and beverage services. Retail trade sales includes gas, and is up 0.4% for the month, up 5.5% from last year.
Clothing had no change from last month and has increased by 5.3% in comparison to this time last year. Sporting goods, books, music, hobby retail sales increased 1.1% and are up 4.3% in comparison to January 2011.
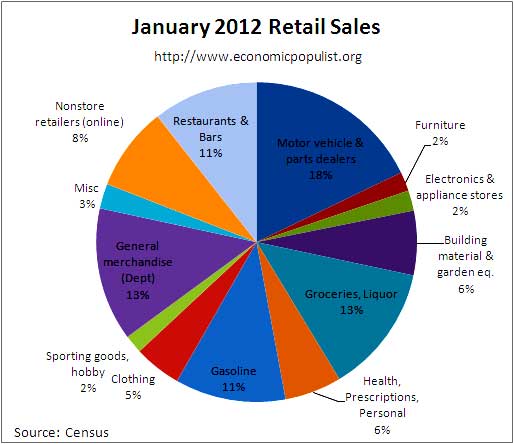
The above chart breaks down seasonally adjusted retail sales by category as a percentage of total January sales. As we can see, electronics are only about 2%. Computer and software store sales (which includes smartphones), are only 22% of the total store sales for the electronics & appliances category. There is a lot of hype surrounding smart phones, but sorry, smart phones do not save the economy. Below is a bar chart breaking down net January 2012 sales revenues reported by surveyed stores (retail outlets).
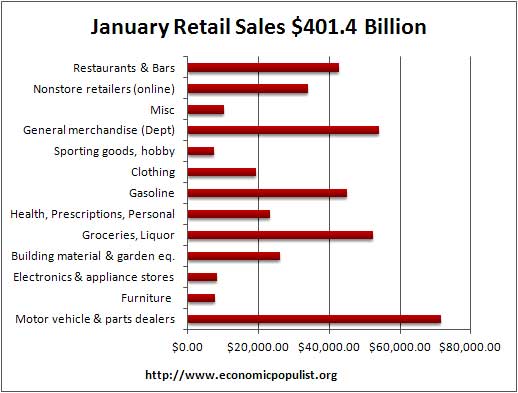
Motor Vehicles & Parts still are the big money of retail sales. We spend more money on our cars than groceries and booze. Motor vehicle sales were down, -1.3%, in January and are up 7.5% in comparison to January 2010. Auto sales were $64.82 billion.
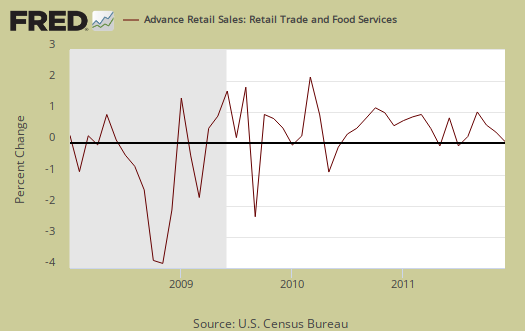
Retail sales are not adjusted for price increases, not reported in real dollars. Real Economic growth adjusts for inflation. Retail sales has variance, margins of error, and is often revised as more raw data comes into the U.S. Department of Commerce (Census division). For example, this report has an error margin of ±0.5%. Data is reported via surveys, and is net revenues of retail stores, outlets. Online retail net revenues are asked in a separate survey of large retail companies (big box marts). This is also the advanced report. To keep the gains in perspective, below is the graph of monthly percentage changes since 2008.
Advanced retail sales are reported three month tallies. There is variation in the monthly reported figures as well as data reporting lag. The three month tally, from November to January, retail sales are up 1.3% from the previous three month period and 6.3% in comparison to the same period a year ago.
Seasonal adjustments are aggregate and based on events like holidays associated with shopping, i.e. the Christmas rush.
Retail sales correlates to personal consumption, which is about 70% of GDP growth. Yet GDP has inflation removed from it's numbers. This is why Wall Street jumps on these retail sales figures. Lord help them if America stops shoppin'. Half of America is poor and poverty rates are as high as 1993. Overall, wages were flat. Increases in real disposable personal income are usually low or declining. In other words, where people are getting the cash to go shoppin' appears to be on credit, or going into more debt.
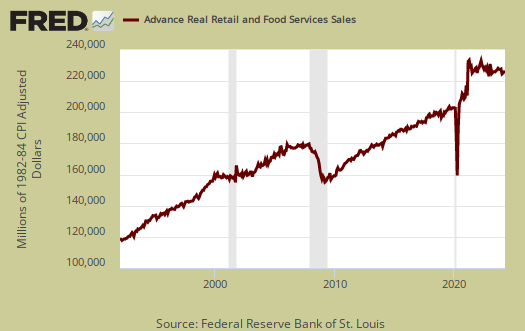
Below is the graph of retail sales in real dollars, or adjusted for inflation, so one gets a sense of volume versus price increases. This graph only goes to December 2011.
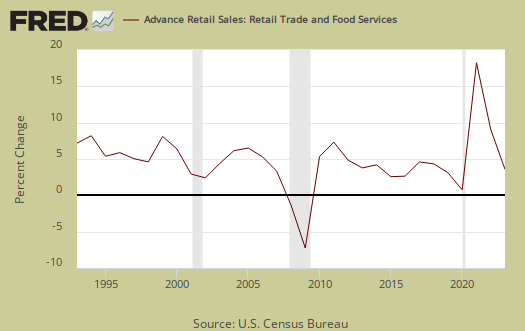
Below is the graph of the annual retail sales percentage change, not adjusted for inflation.
Here is last month's overview unrevised, with additional information on holiday sales. Advance reports almost always are revised the next month.
Recent comments