
Q4 2013 real GDP has come in at 3.2%, a good showing. Personal consumption expenditures was almost 70% of the growth whereas federal government spending took off almost a percentage point of GDP. Exports increased significantly while imports did not.

As a reminder, GDP is made up of: where Y=GDP, C=Consumption, I=Investment, G=Government Spending, (X-M)=Net Exports, X=Exports, M=Imports*. GDP in this overview, unless explicitly stated otherwise, refers to real GDP. Real GDP is in chained 2009 dollars.
This below table shows the percentage point spread breakdown of Q4 from Q3 GDP major components and their spread.
| Comparison of Q3 2013 and Q4 2013 GDP Components | |||
|---|---|---|---|
|
Component |
Q3 2013 |
Q4 2013 |
Spread |
| GDP | +4.13 | +3.22 | -0.91 |
| C | +1.36 | +2.26 | +0.90 |
| I | +2.56 | +0.56 | -2.00 |
| G | +0.08 | –0.93 | -1.01 |
| X | +0.52 | +1.48 | +0.96 |
| M | -0.39 | –0.15 | +0.24 |
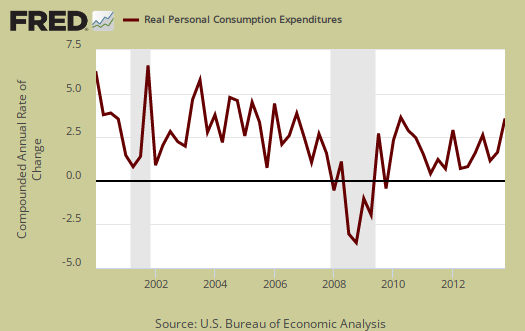
Consumer spending, C in our GDP equation, is almost a percentage point more of GDP than Q3. Spending was fairly evenly spread among various goods and services. Below is a percentage change graph in real consumer spending going back to 2000.
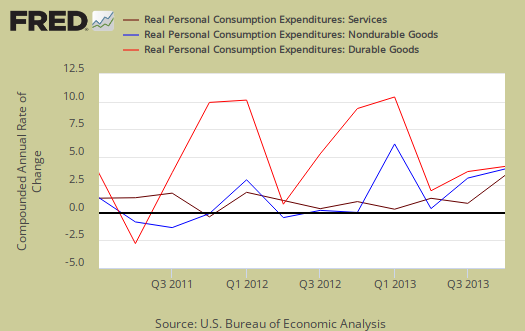
Graphed below is PCE with the quarterly annualized percentage change breakdown of durable goods (red or bright red), nondurable goods (blue) versus services (maroon).
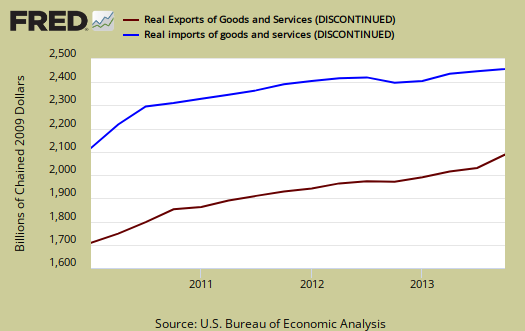
Imports and Exports, M & X added 1.33 percentage points to Q4 GDP as exports grew much more than imports. A word of caution on advance GDP reports, very often imports are significantly revised upwards and data comes into the Census. The BEA estimates data for December that hasn't all be gathered.
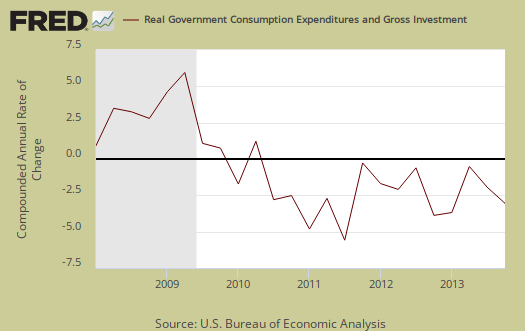
Government spending, G was an amazing -0.96 percentage points of Q4 GDP as federal government spending contracted by –12.6%. These are budget cuts and shut downs showing the deep negative impact on the economy. Defense spending contractions shaved off –0.68 percentage points of GDP and contracted –14.0%. Below is the graph of government spending showing clearly the never ending budget cuts have been a real drag on economic growth.
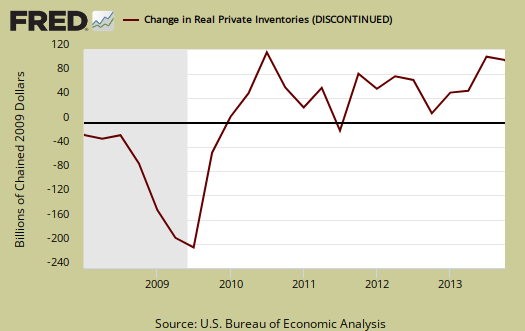
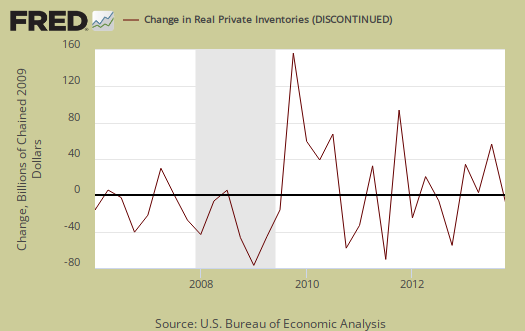
Investment, I is made up of fixed investment and changes to private inventories. The change in private inventories alone gave a +0.42 percentage point contribution to Q4, much less than Q3's 1.67 percentage point blow out. Below are the change in real private inventories and the next graph is the change in that value from the previous quarter.
Fixed investment is residential and nonresidential and added 0.14 percentage points to GDP. Overall, fixed investment contributed +0.89 percentage points to GDP. Nonresidential was 0.46 percentage points of GDP, almost half a percentage point, yet still fairly low. Nonresidential structures by themselves subtracted -0.03 percentage points.

Part of fixed investment is Residential fixed investment. Residential subtracted –0.32 percentage points to Q4 GDP. This isn't surprising since other housing statistics have indicated a contraction. One can see the housing bubble collapse in the below graph and also how there is no meteoric recovery in terms of economic growth.

Nominal GDP: In current dollars, not adjusted for prices, of the U.S. output,was $17,102.5 billion, a 4.6% annualized increase from Q3. In Q3, current dollar GDP increased 6.2%.

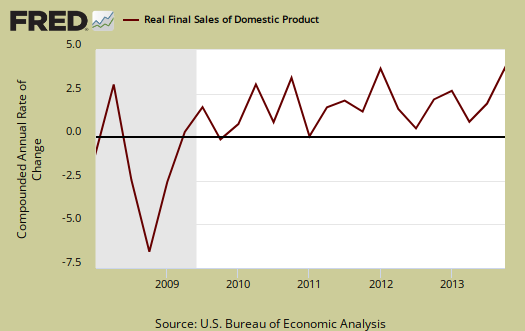
Real final sales of domestic product is GDP - inventories change. This figures gives a feel for real demand in the economy. This is because while private inventories represent economic activity, the stuff is sitting on the shelf, it's not demanded or sold . Real final sales increased 2.8%. Q3 real final sales were 2.5%. This is probably the best news of the Q4 GDP report, as the economy saw a pick up in actual demand.
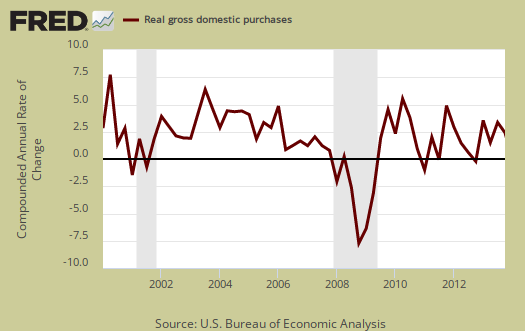
Gross domestic purchases are what U.S. consumers bought no matter whether it was made in Ohio or China.   ; It's defined as GDP plus imports and minus exports or using our above equation: where P = Real gross domestic purchases. Real gross domestic purchases increased 1.8%. Q3 was 3.9%. Exports are subtracted off because they are outta here, not available for purchase by Americans, but imports, as well a know all too well, are available for purchase at your local Walmart. When gross domestic purchases exceed GDP, that's actually bad news, it means America is buying imports instead of goods made domestically.
Below are the revised percentage changes of Q4 2013 GDP components, from Q3. There is a difference between percentage change and percentage point change. Point change adds up to the total GDP percentage change and is reported above. The below is the individual quarterly percentage change, against themselves, of each component which makes up overall GDP. Additionally these changes are seasonally adjusted and reported by the BEA in annualized format.
|
Q4 2013 GDP Component Percentage Change (annualized) |
|||
|---|---|---|---|
| Component | Percentage Change from Q2 | ||
| GDP | +3.2% | ||
| C | +3.3% | ||
| I | +3.4% | ||
| G | –4.9% | ||
| X | +11.4% | ||
| M | +0.9% | ||
Annual GDP is a sore disappointment. &nsbp;For 2013 GDP rose 1.9% where as in 2012 it was 2.8%. Other overviews on gross domestic product can be found here,
Walmart Lowers 4Q Outlook, Cuts to Food Stamps
http://www.foxbusiness.com/industries/2014/01/31/wal-mart-sees-4q-adjust...
http://247wallst.com/retail/2014/01/31/walmart-stumbles-warns-on-profits/
food stamps
They are passing a farm bill which has drastic further cuts to food stamps. Of course subsidies to corporate farms are in the billions still.