
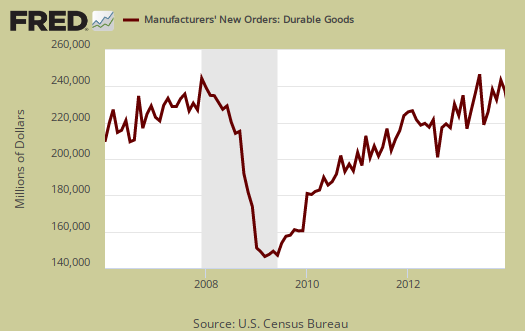
The Durable Goods, advance report shows new orders plunged by -4.3% for December 2013 after a 2.6% increase in November. The really bad news in this report is core capital goods declined by -1.3%. For the last two of three months durable goods new orders as a whole have declined. While December is shaping up to a bad month for the economy, a word of caution as durable goods are often revised dramatically.
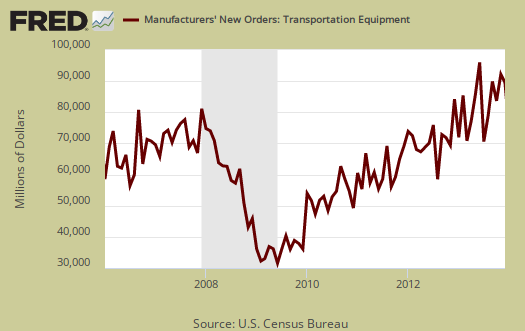
Below is a graph of all transportation equipment new orders, which plunged by -9.5% for the month. This is not due to volatile aircraft orders as Motor vehicles & parts declined by -5.8%, also not a good sign. Aircraft and parts new orders from the non-defense sector decreased -17.5%. Aircraft & parts from the defense sector decreased by -12.9%. Aircraft orders are notoriously volatile, each order is worth millions if not billions, and as a result aircraft manufacturing can skew durable goods new orders on a monthly comparison basis.
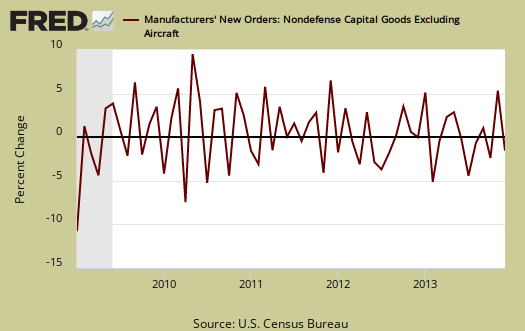
Core capital goods new orders dropped by -1.3% and has declined two of the past three months, although November's core capital goods new orders increased by 2.6%. The drop in core capital goods new orders implies a slowing of economic activity. Core capital goods is an investment gauge for the bet the private sector is placing on America's future economic growth and excludes aircraft & parts and defense capital goods. Capital goods are things like machinery for factories, measurement equipment, truck fleets, computers and so on. Capital goods are basically the investment types of products one needs to run a business. and often big ticket items. A decline in new orders indicates businesses are not reinvesting in themselves. Computers and related products by themselves dropped -7.8% in new orders, although who in their right mind would use Windows 8?
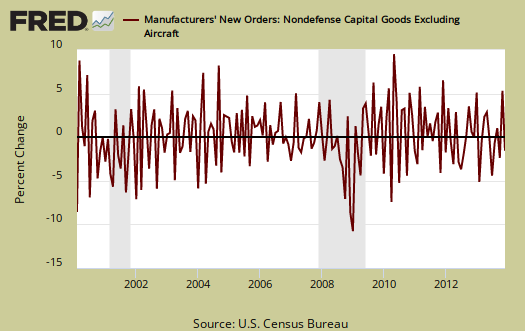
To put the monthly percentage change in perspective, below is the graph of core capital goods new orders, monthly percentage change going back to 2000. Looks like noise right? We use so many graphs to amplify trends for one month of data does not an economy make, so be aware month to month changes can be very misleading.
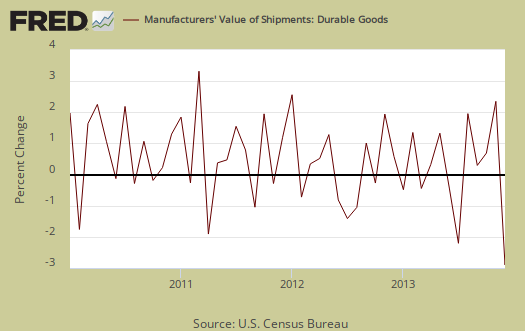
Shipments didn't fare much better and declined by a whopping -1.9%. the first decline in three months. New orders are not necessarily shipped the next month an order is made. Below is the monthly shipments; percent change for all durable goods shipments.
Shipments in core capital goods decreased -0.2% and has declined for two out the last three months. The below graph goes back to 1990 to show how core capital goods shipments tracks recessions, the gray bars in the graph. This is yet another very good indicator something might be finally changing in the economy, a glimmer of sustained hope.

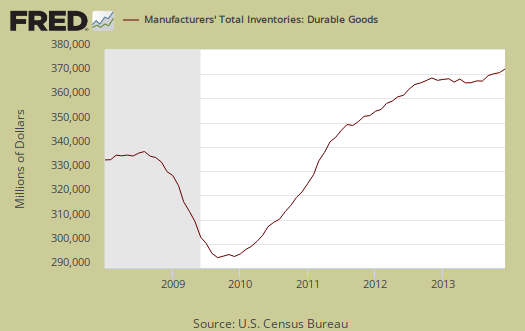
Inventories, which also contributes to GDP, increased 0.8%. Growth in inventories was 40% of Q3 GDP, of which durable goods inventories are a part, so seeing growth instead of contraction is surprising and could also indicate accumulation due to slower demand. Graphed below are total durable goods inventories monthly figures.
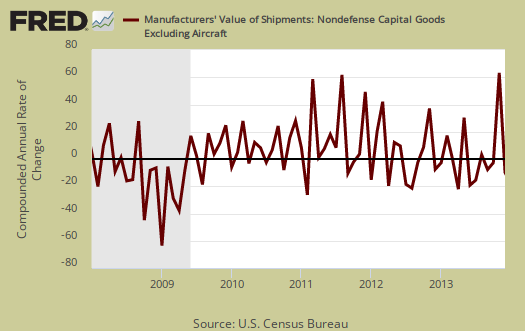
Core Capital Goods inventories increased 0.3% for the month. Graphed below are monthly core capital goods inventories annualized percentage change and pay close attention to the months of Q3, against the Q4 months. The below implies we will not see the corresponding cliff dive to Q3's build up, at least from durable goods core inventories.

Core shipments contributes to the investment component of GDP. Producer's Durable Equipment (PDE) is part of the GDP investment metric, the I in GDP or nonresidential fixed investment. It is not all, but part of the total investment categories for GDP, usually contributing about 50% to the total investment metric (except recently where inventories have been the dominant factor). Producer's Durable Equipment (PDE) is about 75%, or 3/4th of the durable goods core capital goods shipments, in real dollars, used as an approximation. Below is the national accounts description of PDE:
Nonresidential PDE consists of private business purchases on capital account of new machinery, equipment such as furniture, and vehicles (except for personal-use portions of equipment purchased for both business and personal use, which are included in PCE), dealers' margins on sales of used equipment, and net purchases of used equipment from government agencies, from persons, and from the rest of the world.
The below graph might give a feel for what kind of investment component we might see shaping up for PDE and it's lookin' good for Q4. Note the below is the annualized monthly percentage change of nominal values, not real, not adjusted for inflation, for core capital goods shipments.
The report excludes semiconductor manufacturing and we must wonder if that means it is non-existent since so much has been offshore outsourced and thus corporations don't want the public to figure that fact out.
What is a durable good? It's stuff manufactured that's supposed to last at least 3 years. Here are our durable goods, related overviews, only some graphs revised. The durable goods advance report is often revised when the full factory orders statistics are released.
Recent comments