
The May personal income and outlays report shows a massive increase of 0.9% in consumer spending, which is great news for economic growth. Adjusted for inflation consumer spending rose 0.6%. Personal income also increased 0.5% Real disposable income increased 0.2% for the month.
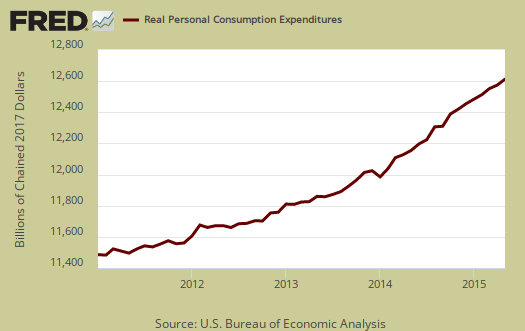
Consumer spending is another term for personal consumption expenditures or PCE. Real personal consumption expenditures were $11,276.9 billion for May. Consumer spending is roughly about 68% of GDP. Real means adjusted for inflation and is called in chained 2009 dollars
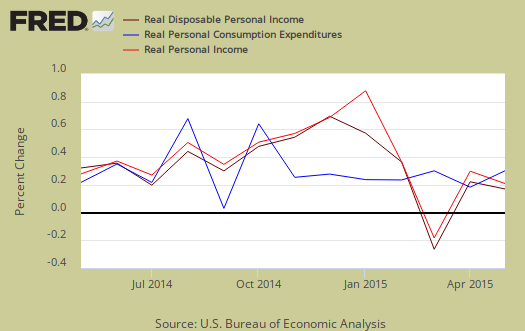
Disposable income is what is left over after taxes and increased 0.2% when adjusted for prices. Graphed below are the monthly percentage changes for real personal income (bright red), real disposable income (maroon) and real consumer spending (blue).
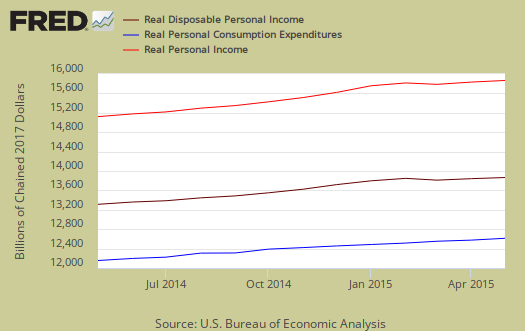
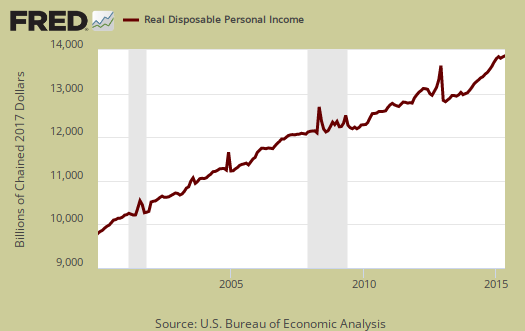
Below are the real dollar amounts for real personal income (bright red), real disposable income (maroon) and real consumer spending (blue) for the last year.
Consumer spending encompasses things like housing, health care, food and gas in addition to cars and smartphones. In other words, most of PCE is most about paying for basic living necessities. Graphed below is the overall real PCE monthly percentage change.

The reason for the increase in spending was durable goods. Cars are a durable good sand motor vehicles and parts were identified as half of the durable goods increase. Nondurable goods are things like gasoline and food. Services are things like health care. When people are cutting back on their spending, durable goods are usually the first things to go, especially large ticket items. Below are the real monthly percentage changes in 2009 chained dollars:
- Durable goods: 2.3%
- Nondurable goods: 0.9%
- Services: 0.2%
Price indexes are used as divisors to adjust for inflation and price changes. The indexes are used to compute spending and income for an apples to apples, real dollar comparison to previous months and years. Economic statisticians use real dollars so one does not erroneously assume economic growth when the increase is really just inflation. The PCE price index is also a Federal Reserve inflation watch number. The PCE price index is used to remove inflation from consumer spending and income, reported above as real, or in chained 2009 dollars
The price index increased 0.3%, as gasoline prices increased The price index is now up 0.3% from a year ago. Minus energy and food, the price index increased 0.1% from last month and is up 0.2% from this time last year, well below the Fed's 2.0% target rate. While the PCE price index represents inflation, it is different from CPI, although the two typically mirror each other.
Graphed below is the PCE price index, in red, scale on the left, and the PCE price index minus food and energy in blue, scale on the right. This is the percent change from one year ago.

Personal income is total income, from all sources, for everybody in the United States who reported and are not part of the underground economy. Below is personal income, not adjusted for inflation, or price changes. Personal income was an annualized $15,307.0 billion, a 0.5% monthly increase.

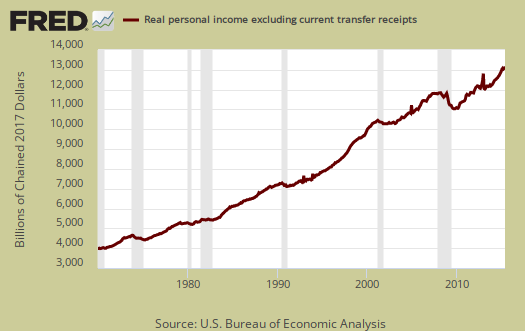
The BEA reports real personal income or income adjust for inflation, as real personal income minus transfer receipts. This is government payments, such as social security, removed and also adjusted for inflation. Real personal income minus transfer receipts increased 0.3% for the month. The graph shows how much personal income increased that wasn't funded by the government and is used as a recession indicator as show in the below graph with the gray bars indicating recessions. Transfer receipts are payments from the government to individuals where no actual services (work) was performed. This includes social security, unemployment insurance, welfare, veterans benefits, Medicaid, Medicare and so on.
Disposable income is what is left over after taxes. DPI increased 0.5% from last month. DPI adjusted for inflation (see the price indexes above), increased 0.2%, from the previous month. These numbers are aggregates, which includes income of the uber-rich, or the 1% of the population, as they are now called. Below is real DPI by levels.
Taxes collected on person income increased 0.7% from last month. Below is a graph of personal income taxes.

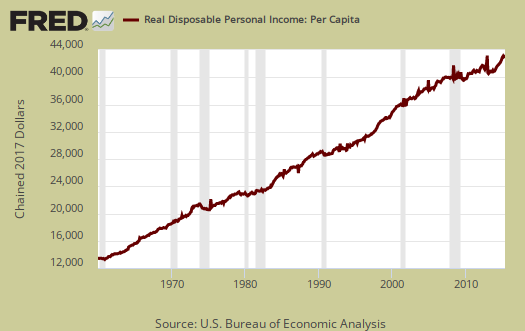
Graphed below is real disposable income per capita. Per capita means evenly distributed per person and population increases every month. While income in the U.S. grows so does the population which earns that total pot of income. Notice how real disposable income per person really started to flatline in 2000. That's just when offshore outsourcing to China started in earnest.
Wages and Salaries increased by 0.5%. Overall employment compensation also increased by 0.4%. . Graphed below are wages and salaries since 2000. Notice the dip and the more flat line than earlier in the decade. Bear in mind these are aggregate, or all wages and salaries, and not adjusted for inflation.

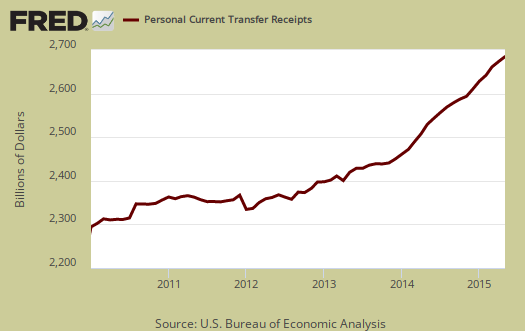
Transfer receipts, which are things like social security increased 0.1%, not adjusted for inflation. Below is a graph of just transfer receipts.
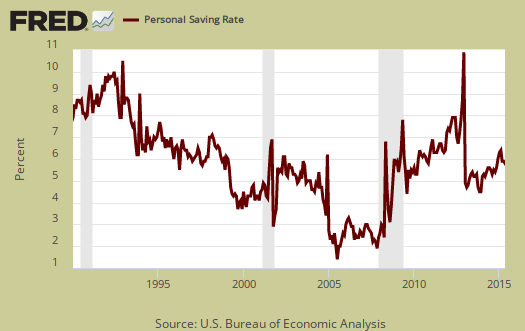
Personal savings is disposable income minus outlays, or consumption and not adjusted for inflation. The Personal Savings Rate was 5.1%.
To visualize more data from this report, consider playing around with more of the St. Louis Federal Reserve Fred graphs. Here are our overviews of personal income & outlays and overviews of GDP are here. This overview details the BEA Personal Income and Outlays statical release, which covers individual income, consumption and savings. The personal income & outlays report is annualized and seasonally adjusted, although most percentages are presented as monthly rates.
estimating GDP from two months PCE
to estimate the change in PCE that applies to GDP, we have to compare April and May real PCE to the real PCE of the 3 months making up the first quarter...that's done by applying the monthly PCE price index, from Table 9 in the pdf, to the current dollar values of each month's annualized PCE; that gives us monthly PCE in chained 2009 dollars, which aren't really dollar amounts at all but merely the means that the BEA uses to compare one month's or one quarter's real goods and services produced to another...that result is shown in table 7 of the PDF, where April's annualized chained dollar consumption works out to 11,214.7 million and May's annualized chained dollar consumption is 11,276.9, which we can then compare to the 1st quarter's annualized chained dollar PCE of 11,177.9 shown in Table 8, which is identical to the inflation adjusted first quarter PCE from table 3 in the first quarter GDP report we just reviewed...since we dont yet know real PCE for June, one method of estimating the 2nd quarter change in real PCE is to average the two months we do have and compare them to the 1st quarter...when we do that, we find that 2nd quarter real PCE has grown at a 2.5% annual rate for the two months we do have; note the math to get that annual rate: (((11,214.7 +11,276.9 ) / 2) / 11,177.9 ) ^ 4 = 1.02452... given that real PCE is about 68% of GDP, we could thus estimate that growth in real PCE would add 1.67 percentage points to 2nd quarter GDP...and that has to be considered the low end estimate; even if June's PCE is unchanged from May, our equation becomes (((11,214.7 + 2 * 11,276.9 ) / 3) / 11,177.9 ) ^ 4 = 1.02830, meaning PCE growth at a 2.8% annual rate, which would add 1.92 percentage points to 2nd quarter GDP...
rjs
yup gonna help 2nd quarter GDP
although other elements may pull it back down of course.
construction spending
construction spending for May was up 0.8% over an April that was up 2.2% over March...i know you can see the double digit annual growth rate there...at the April rate of construction growth, i figured 2nd quarter residential construction would add .26 percentage points to 2nd quarter GDP growth, private non-residential would add .83 percentage points to 2nd quarter growth, and public construction would add .42 percentage points to 2nd quarter GDP in the various government investment components...now we're above that already in May...
the caveat to my figures is that there are dozens of construction price indexes and i just estimated a deflator
rjs
deflators
might be an article to show how Census construction spending goes into GDP report. Deflators ain't easy and seems BEA has some secret sauce going on.
the construction spending sauce
from the National Income and Product Accounts Handbook, Chapter 6 (pdf), we find that the deflators used for residential investment are the Census Bureau price indexes for new one-family houses under construction and for new multi-family homes under construction; while a bunch of other indexes are used to deflate other components of construction spending, ie, the Turner Construction building-cost index for several types of buildings, the PPI for new school construction, the Engineering News Record construction cost index for utilities construction, and so forth..in addition, the GDP categories for construction spending include brokers’ commissions, title insurance, state and local taxes, attorney fees, title escrow fees, fees for surveys and engineering services, and remodeling that are not all captured in the construction spending report...in the face of all that, i opted to look up the residential index and just use the deflator BEA used in the most recent quarter for all other construction in making my estimates, figuring construction prices aren't that volatile and the figures would be revised in the next month anyway..
rjs