
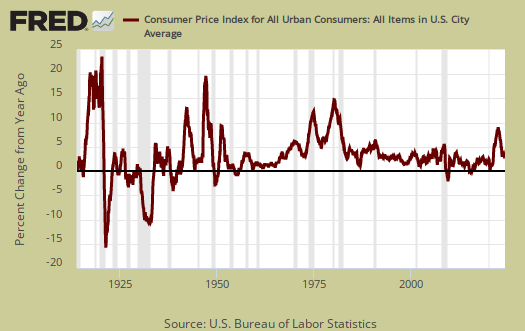
The monthly Consumer Price Index dropped -04% for December, the largest monthly drop since 2008 Once again it's all about falling oil prices. Gasoline prices declined the steepest since December 2008. Inflation with gas and food removed flat-lined and had no change from last month. CPI measures inflation, or price increases.

CPI has only increased 0.8% from a year ago and this is the lowest yearly increase since October 2009. CPI is approaching the deflationary period of 2008-2009 and deflation has it's own set of major problems.
Core inflation, or CPI with all food and energy items removed from the index, has increased 1.6% for the last year. Core CPI is one of the Federal Reserve inflation watch numbers and 2.0% per year is their target rate. Deflation is a grave concern for the Federal Reserv. Yet the recent collapse in oil impacting inflation might force the Fed's hand to keep interest rates effectively zero for longer. If CPI and other inflation measures go negative, look to the Fed to raise rates later rather than sooner. Graphed below is the core inflation change from a year ago.

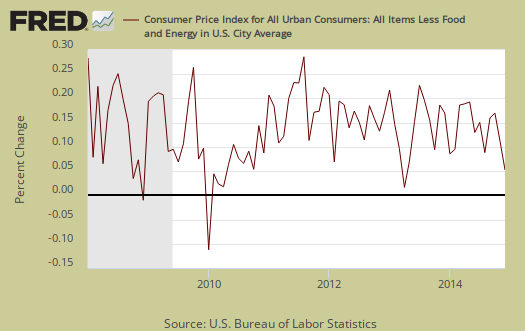
Core CPI's monthly percentage change is graphed below. This is only the second time since 2010 core inflation has had no monthly change.
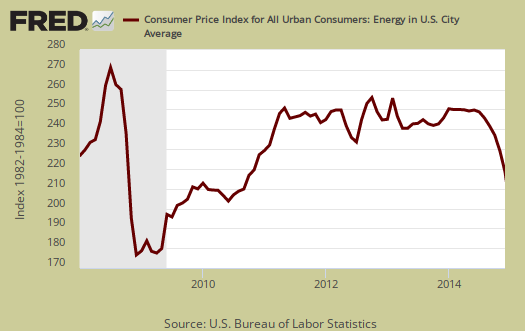
Energy overall declined -4.7% for the month and energy costs are now down -10.6% from a year ago. This decline should be even more dramatic next month since oil & gas prices are still dropping like a stone. The BLS separates out all energy costs and puts them together into one index. Gasoline dropped -9.4% for the month and has declined -21.0% for the year. Fuel oil dropped -7.8% for the month, down -19.1% for the year. Natural gas is now up 5.8% from a year ago with a monthly increase of 1.5%. Electricity increased 0.8% for the month and is now up 3.1% for the year. Graphed below is the overall CPI energy index.
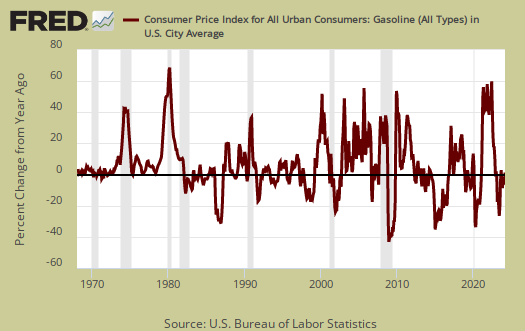
Graphed below is the CPI gasoline index only, which shows gas prices wild ride. Gasoline is best news for consumers but now ravaging other aspects of the global economy.
Core inflation's components include shelter, transportation, medical care and anything not food or energy. Many things dropped except our usual suspects, medical costs and housing costs. The shelter index is comprised of rent, the equivalent cost of owning a home, hotels and motels. Shelter increased 0.2% and is up 2.9% for the year. Rent increased 0.2% for the month, 3.4% for the year. This is the national average,, rents in some areas of the country are just soaring. Home prices are increasing as reflected in the cost for home owners increased 2.6% for the past year as well. Graphed below is rent, where cost increases hits the people who can least afford it.

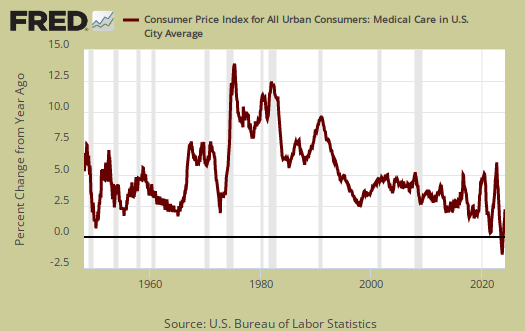
Medical care services increased 0.3% for the month and are up 2.4% for the year. Graphed below is the overall medical care index change from a year ago.
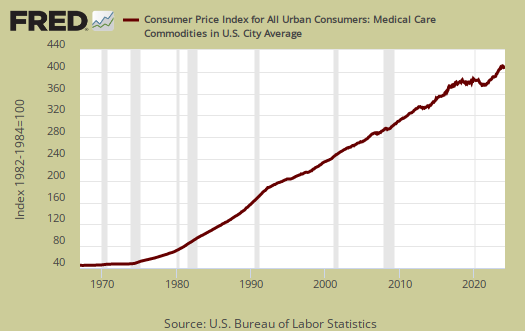
Below is a graph of the medical commodities index, which in large part consists of prescription drug prices, up a whopping 1.0% for month and 4.8% for the past year. Notice the beyond belief never ending increases since 1975 in the below graph. Meanwhile Americans are force feed expensive pharmacuetical marketing campaigns to the point that act, by itself, is probably making people sick. Prescription drugs by themselves have increased a full 6.4% from a year ago.
Food and beverages overall increased 0.3% for the month and have increased 3.4% from a year ago. The food at home index, i.e. groceries, increased 0.3% for the month and 3.7% for the year. Eating out, or food away from home increased 0.3% from last month and is up 3.0% from a year ago.

Graphed below is the food at home index, which is deceptive due to the BLS assuming one will substitute items when a large increase occurs.

Individual food items so one gets a better feel for what is going on. Beef & veal are up 18.7% for the year with a monthly 0.7% increase. Dairy is up 5.3% for the year. nbsp;It is not your imagination, groceries have increased dramatically.
The BLS released real hourly earnings for December. The average hourly real wage rose 0.1% and is now $$10.40 and has increased 1.0% from a year ago. Yet for December, hourly wages actually declined -0.2% but the drop in inflation by -0.4% counteracted the lightened pocketbook. Weekly real earnings have increased 1.9% for the year. It would have been worse but people were working 0.9% more hours per week than a year ago.
CPI details
The DOL/BLS does take yearly surveys on where the money goes in the monthly budget, but as one can see, food and energy are significant amounts of the monthly finances. Run away costs in these two areas can break the bank, so can food. Additionally CPI uses substitution, so if flour goes through the roof, somehow we're all just fine with oats and prices didn't really overall increase much. Here is the BLS CPI site, where one can find much more details, information on calculation methods and error margins.
Other CPI report overviews, unrevised, although most graphs are updated, are here. If you're wondering why the graphs display different figures from the text, the graphs calculate percentages from the index and do not round. The actual data from the BLS report does round to one decimal place. In other words, 0.05% is rounded to 0.1%.
the impact of lower prices
it wasn't just the CPI that was down this week; import prices fell 2.5% in December, export prices fell 1.2%, and producer prices fell 0.3%...a falling price environment changes the way we have to think about most of the other reports that we review, because any downturn they indicate may be just due to lower prices....for instance, last week it was reported that November wholesale sales fell by 0.3%, while wholesale inventories rose by 0.8%; that was in part because wholesale petroleum sales fell by 2.1%, and despite the fact that wholesale petroleum inventories fell by 3.7%....but since wholesale crude oil prices were down 3.2% in November, that means actual sales of barrels of petroleum rose about 1.1%, while inventories, in barrels of oil, just fell 0.5%...with crude oil prices down 18.9% in December, it's almost a certainty that wholesale sales and inventories of non-durable goods, denominated in dollars, will fall when that report is released three weeks from now...but even so, such a report would indicate a positive contribution to GDP if the actual quantity of goods produced and sold or inventoried increases, irregardless of the headline change...in fact, even if GDP falls in dollars in a given quarter, it's still possible that quarter's GDP will be recorded as an increase if the deflator is negative...
rjs
There is No Inflation
ZeroHedge says, "There is no Inflation (Unless you eat food, use water, live in a house, get sick, go to school or do taxes)
http://www.zerohedge.com/news/2015-01-17/there-no-inflation-unless-you-e...
There Is No Inflation
Just who are you trying to kid? Read ALL of your populist literature and then rewrite this. When was the last time you bought a box of Wheat Thins?! Sure, the price is basically the same as years ago, but the SIZE OF the box has shrunk considerably. That is inflation, pure and simple. And the shrinkage phenomenon is evident on every grocery aisle. Get over yourself.