
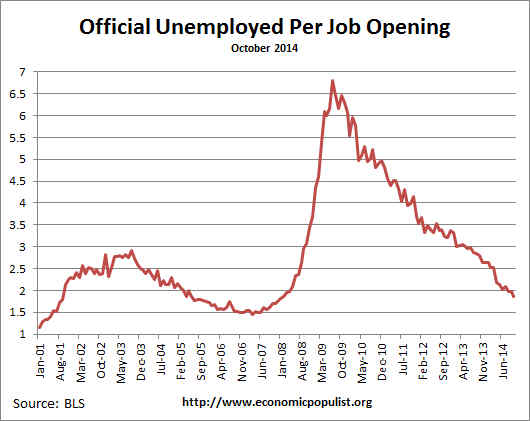
The BLS JOLTS report, or Job Openings and Labor Turnover Survey shows there are 1.9 official unemployed per job opening for October 2014. Job openings were around 4.8 million. Job openings returned to pre-recession levels while hires has increased 33% since June 2009. In just the private sector job openings have also recovered to precession levels while private hires have increased 40% from their 2009 lows.
There were 1.8 official unemployed persons per job opening at the start of the recession, December 2007. Below is the graph of the official unemployed per job opening, currently at 1.9 people per opening.
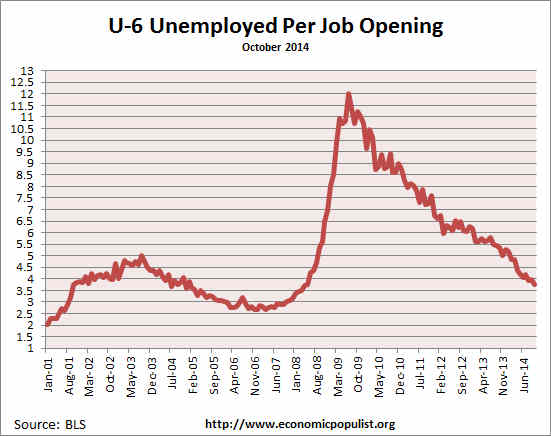
If one takes the U-6 broader measure of unemployment that includes people who are forced into part-time work and the marginally attached, the ratio is 3.8 people needing a job to each actual job opening. In December 2007 this ratio was 3.2.
Job openings have not been this high since January 2001, the height of the dot con bubble. By either measure it is clear job openings have finally returned to pre-recession levels. Graphed below are raw job openings. Currently job openings stand at 4,834,000.

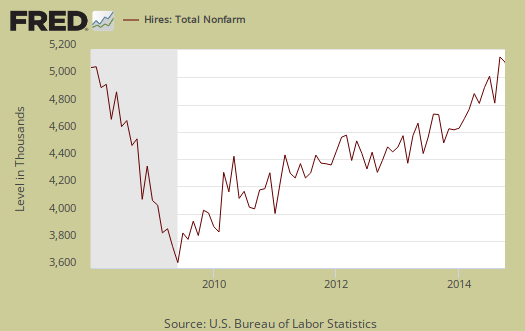
Since the July 2009 trough, actual hires per month have only increased 32.8%, Total hires are still below pre-recession levels, but not by much, about 2.4%. In the private sector hires are about 2.1% below their pre-recession levels. Bear in mind on levels the working population has increased significantly since 2007, so the lack of a hiring boom shows sluggish work opportunities. Additionally, Businesses can say there are job openings, but if they do not hire an American and fill it, that doesn't help the labor situation. In truth, businesses are trying to squeeze workers and import cheap labor instead of hiring Americans at middle class wages and benefits. Below is the graph of actual hires, currently 5,055,000.
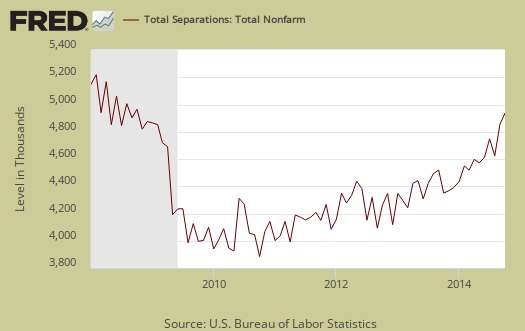
Graphed below are total job separations, currently at 4,824 million. The term separation means you're out of a job through a firing, layoff, quitting or retirement and is also called turnover.
Layoffs and firings were 1.7 million, which is a return to July levels. Below is a graph of just layoffs and firings. One can see from labor flows businesses are not trashing their workforce like they did in past years. Labor flows means the way people are hired, stay at a job, quit, get fired, get another job and so on. It is the overall flow of the labor market for as people are get jobs, they also lose them.

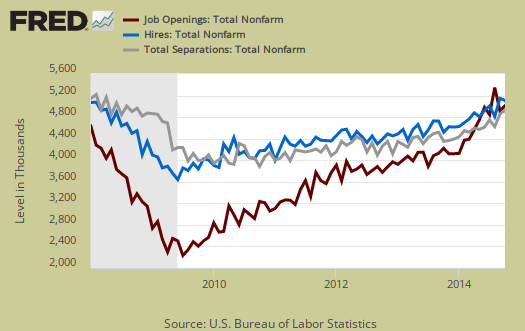
Graphed below are openings, separations and hires levels, so we can compare the types of labor flows. While layoffs have declined to pre-recession levels, it is the hires (blue) that needs to increase. The below figures also disprove a labor shortage. A labor shortage would imply more job openings than unemployed available to fill them.
Graphed below are people who quit their jobs minus those who were fired and laid off. The lower the bar on the below graph, the worse labor conditions are. Workers quit their current jobs often to obtain better ones. People feeling free enough to leave their current positions is considered a positive labor market sign. Quits were 2.72 million. Quit statistics are still below pre-recession levels of 2.9 million, but have increased 65.5% since their September 2009 trough.

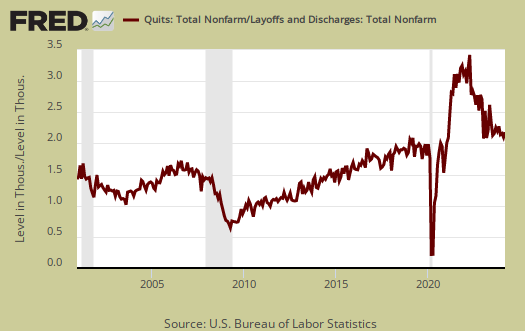
Below is a graph of the quits to layoffs ratio, currently at 1.6. This ratio of people who quit their jobs vs. those who were fired gives an indicator of worker churn as well as if there might be a shortage. If the ratio is below 1.0, this means more people are being laid off and fired than people who quit. When the ratio is much higher, this means more people quit their jobs and thus implies there is better opportunity elsewhere and workers feel free enough to move on to obtain those new better jobs. The quits to fires ratio was 1.9 in 2006.
One of the best statistics from the JOLTS report is the net employment gain. For the year, from October 2013 to October 2014, there was a gain of 2.6 million employed. From the JOLTS report:
Over the 12 months ending in October 2014, hires totaled 57.2 million and separations totaled 54.5 million, yielding a net employment gain of 2.6 million. These figures include workers who may have been hired and separated more than once during the year.
The bottom line is the situation is improving, yet not as strongly as some would believe or headlines would say. The hidden element in these statistics is how long it has taken to return to 2007 levels. The number of people needing work has increased due to population growth during this time and thus one needs many more jobs to accommodate the new potential workers. It is soon to be 2015, that's going on eight years of employment malaise.
For the JOLTS report, the BLS creates some fairly useful graphs beyond the above and they have oodles of additional information in their databases, broken down by occupational area. That said, one doesn't know if the openings are quality jobs from the JOLTS statistics.
The JOLTS takes a random sampling of 16,000 businesses and derives their numbers from that. The survey also uses the CES, or current employment statistics, not the household survey as their base benchmark, although ratios are coming from the household survey, which gives the tally of unemployed.
The August 2014 unemployment rate was 6.1%. U-6 alternative unemployment rate was 12%. JOLTS includes part-time jobs and does not make a distinction between part-time, full-time openings. A job opening reported to the survey could literally be take out the trash twice a week and be counted. This is a shame, it would be nice to know a little more about the quality of these new opportunities. Here are our past JOLTS overviews, unrevised.
Supreme Court Rules Against Workers
On Tuesday, the U.S. Supreme Court came down unanimously against a group of temporary workers in Amazon warehouses. The workers were required to undergo mandatory, unpaid theft screenings once their shifts ended, and their case (Integrity Staffing Solutions v. Busk) focused on whether they should be compensated for that time.
Addressing the workers' arguments, the court's opinion, delivered by conservative Justice Clarence Thomas, included this curious line: "These arguments are properly presented to the employer at the bargaining table … not to a court in an FLSA claim."
It's not clear whether the irony was intended. Amazon's U.S. warehouses, of course, are entirely non-union. Workers, therefore, have no bargaining table at which to sit, a fact noted Tuesday by the National Employment Law Project, an advocacy group for low-wage workers.
http://www.huffingtonpost.com/2014/12/09/clarence-thomas-amazon-ruling_n...
EPI on JOLTS
From the Economic Policy Institute, regarding the new JOLTS report and saying only 2 were unemployed for every job opening:
"9.0 million unemployed workers understates how many job openings will be needed when a robust jobs recovery finally begins, due to the existence of 5.8 million potential workers who are currently not in the labor market, but who would be if job opportunities were strong. Many of these “missing workers” will go back to looking for a job when the economy really picks up, so job openings will be needed for them, too ... When a job opening goes unfilled when the labor market is weak, as it is today, companies may very well be holding out for an overly-qualified candidate at a cheap price."
Source:
http://www.epi.org/blog/jolts-report-mostly-on-trend-jobs-seekers-to-job...
My comment at the EPI awaiting moderation:
There are 69,000 more Americans "not in the labor force" than there were the month before.
http://data.bls.gov/timeseries/LNS15000000
Since Great Recession "officially" ended, we've had 11 million more "not in the labor force".
http://bud-meyers.blogspot.com/2014/08/since-recession-ended-11-million-...
From the BLS: Number of persons “not in the labor force” but who currently want a job --- 6.2 million (up from 5.4 million a year ago)
http://www.bls.gov/news.release/empsit.t16.htm
Fall below 2.0, not 2.0
It is fall below and this is the first time. Will add to article. I calculate these figures from the data, this article is correct unless i made a calculation error, which I did not.
Also, on EP, the number who want a job is already in an article, no reason to link to the raw source instead of our article with the information further calculated and graphed.
Oil Prices and the DOW
Labour market non-tightness
You wish you could know about the quality of the jobs coming through. Look at nominal average hourly wage growth. It's still way below pre-recession trends. The labour market cannot be tight until nominal wages are being bid up, and bid up for some time.