Jehu's blog

Another dumb idea to avoid reducing work time: $5000 for an ounce of gold

This particularly dumb idea is from Paul Brodsky and Lee Quaintance of QB Partners.

They suggest: Rather than reducing hours of work, why not have Washington offer to buy gold at $5000 an ounce:

A coordinated global currency devaluation. The Fed, for example, tenders for private gold holdings at $5000/oz and maintains that bid/offer. As the Fed purchases gold, the gold flows to the asset side of its balance sheet. The Fed funds these gold purchases with newly-digitized money, which flows to banks in the form of net new deposits. This would be a discrete monetary inflation event (devaluation) and a simultaneous deleveraging.

Once the Fed acquires enough gold from the markets, a gold price peg for the US dollar is established. Would this be a gold standard? Yes, if that nominal exchange value is maintained in the open market by the Fed. No, if the Fed decides to periodically adjust that $5000/oz. level following the original exchange. (In fact, tinkering with the official gold price would be a pure example of a monetary agent conducting monetary policy.)

Wages versus gold: A look at historical data

One of the most visible measures of the condition of working families is the price level of a day’s wages. So, we figured it might make sense to subject those wages to the same sort of analysis we used in the last post: the withering criticism of an ounce of gold.

Here is a chart of an average day’s wage since 1964, as presented by the Bureau of Labor Statistics:

 Average wages in dollars

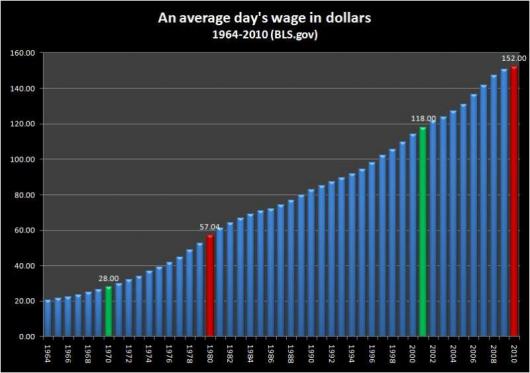
Chart 1: Average day's wage in dollars (1964-2010) (Source: bls.gov)

As is befitting a labor force enjoying the prosperity of the freest, most productive, nation on the planet, we have seen our wages rising for the entire period from 1964 to 2010. Even through depressions as intense as that of the Great Stagflation (the first set of green and red bars) and the current Great Recession (the second set of green and red bars) the average day’s wage of American workers has never fallen year over year.

Unfortunately, things are not so rosy when the value of a day’s wage is measured by an ounce of gold:

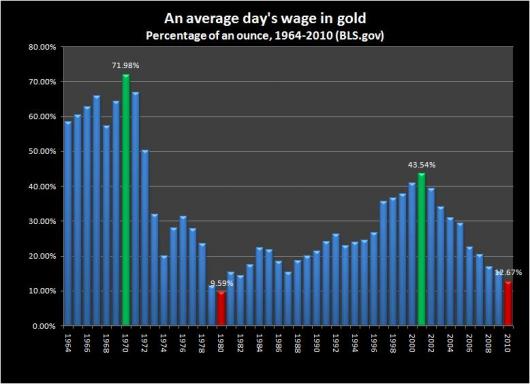
Chart 2: Average day's wage in gold (1964-2010) (Source: bls.gov)

Not ready for prime time: Some ideas on the relationship between gold and depressions

Barry Eichengreen and Kevin H. O’Rourke have been updating us on the progress of this depression by comparing it to the big one, The Great Depression. Their original post, in April 6, 2009, captivated their audience.

One thing that struck me was that we might compare the two events to the totally overlooked depression of the 1970s – The Great Stagflation. The reason why this one is missing and, perhaps, lost from official economic history is that it did not look anything like how we expect a depression to look – at least by the accepted, albeit vague, standard of what constitutes a depression. For instance, as shown in the graph below, year over year Gross Domestic Product enjoyed an unbroken expansion during the entire period.


USGDPYOY - 1970-1980.jpg

Chart 1 (Source: Bureau of Economic Analysis)

Compare this performance to the contraction of GDP during the Great Depression


 USGDPYOY%20-%201929-1933.jpg

Chart 2 (Source: Bureau of Economic Analysis)